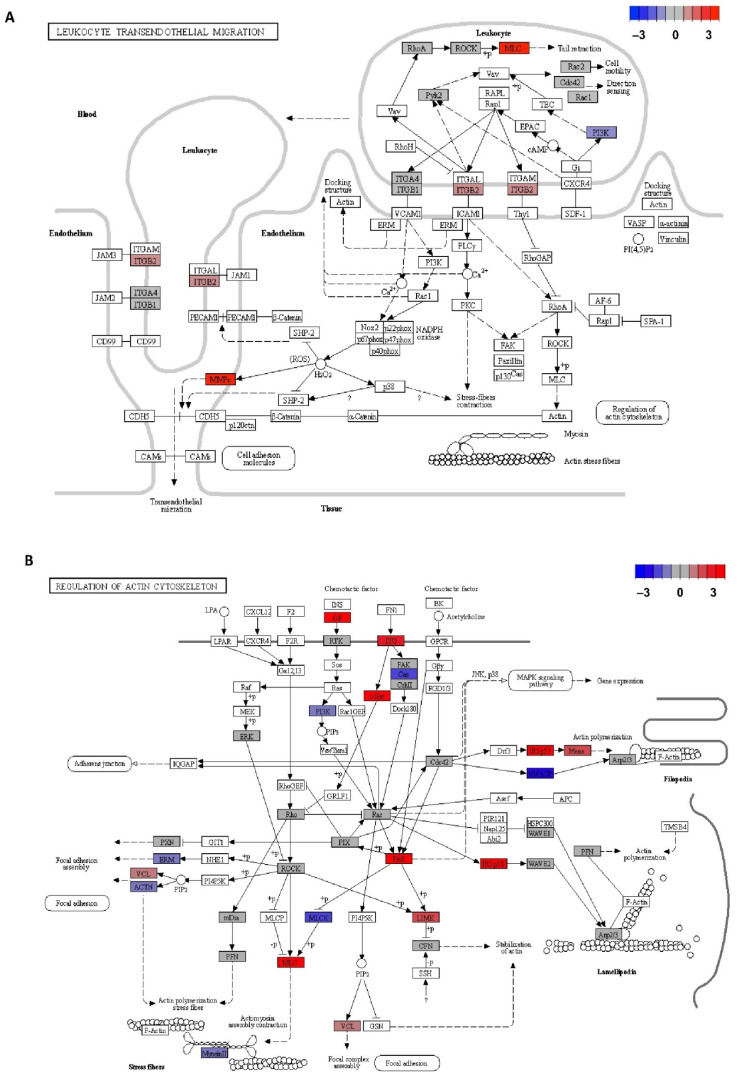
Figure 5.
KEGG pathways representation with the differentially expressed genes in CD4+CD28null T lymphocytes with respect to CD4+CD28+ T lymphocytes stand out with colour. (A) Leucocyte transendothelial migration pathway (hsa 04670 entry). (B) Regulation of actin cytoskeleton pathway (hsa 04810 entry). Log2 of the fold change extracted from migration array assays was calculated, and differentially expressed genes were represented in base of this value with a colour scale from dark red (upregulated genes in CD4+CD28null T lymphocytes) to dark blue (downregulated genes in CD4+CD28null T lymphocytes). Arrows mean activation. Dashed arrows mean indirect effect. Lines mean binding. Blunt end lines mean inhibition.

