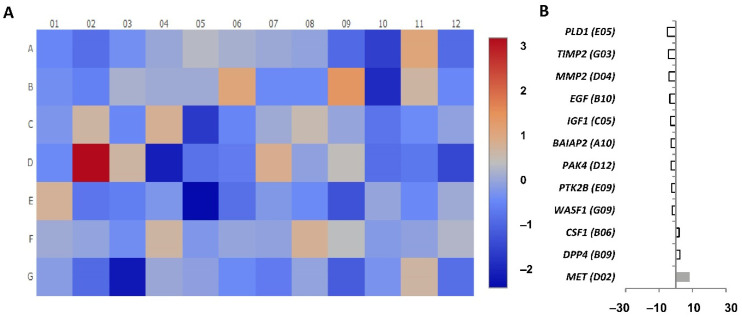
Figure 6.
Cell motility array results comparing CD4+CD28null IL-15 stimulated (test sample) with CD4+CD28null basal condition (control sample) testing the expression of 84 different genes. (A) Heatmap performed by calculating the log2 of the fold change for each gene. The figure represents the level of expression of each gene with a colour scale from dark red (more expression in CD4+CD28null+IL-15) to dark blue (less expression in CD4+CD28null+IL-15). (B) Representation of the genes with significant expression differences. Grey bars represent fold regulation of genes with an expression difference higher than five but lower than 10. White bars represent fold regulation of genes with an expression difference higher than two. The wells corresponding to each gene are in brackets.

