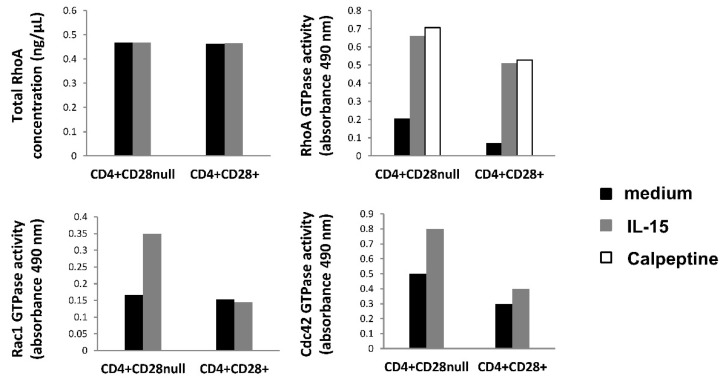
Figure 7.
GLISAS analysis. CD4+CD28null and CD4+CD28+ T cells were separated and, after 1 h of starvation, were incubated with and without IL-15 (50 ng/mL) stimulation. Protein extracts were obtained from each condition, and GLISAS experiments were made with them. Upper histograms show the results obtained for the RhoA protein; the left one represents the total protein RhoA concentration; the right one shows the GTPase activity of RhoA. Bottom histograms represent the GTPase activity of Rac1 (left) and Cdc42 (right). Basal conditions are represented in black; IL-15 stimulation conditions are in grey, and calpeptin positive control of RhoA activity in white.

