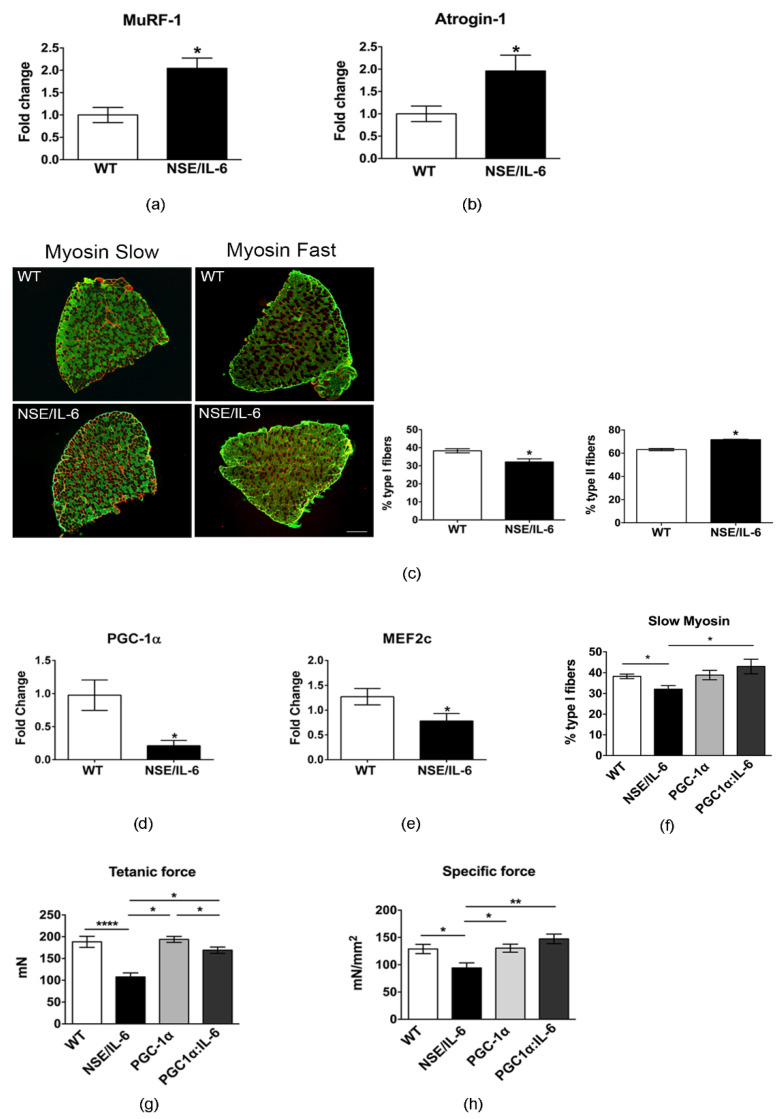
Figure 4.
IL-6 overexpression impinges the heterogeneity of muscle fibers. (a,b) Real time PCR of ubiquitin-proteasome markers, Atrogin-1 and MuRF1 in soleus of wild type (WT) and NSE/IL-6 mice at 6 months of age. Values are expressed as fold change variations relative to WT and are presented as means ± SEM and n = 4; * p < 0.05. Statistical significance assessed by Mann–Whitney Rank Sum Test. (c) Immunofluorescence staining of wild type (WT) and NSE/IL-6 soleus muscles immunolabeled with either a mouse anti-myosin slow or a mouse anti-myosin fast antibody at 6 months of age. Scale bar 250μm. At the right, graphs showing the percentage of positive type I (left) or type II (right) muscle fibers. Data are represented as average ± SEM. n = 4 * p< 0.05. Statistical significance assessed by Mann–Whitney Rank Sum Test. (d,e) Real time PCR for the expression of PGC-1α and MEF2c in soleus of wild type (WT) and NSE/IL-6 mice at 6 months of age. Values are presented as means ± SEM and n = 4; * p < 0.05. Statistical significance assessed by Mann–Whitney Rank Sum Test. (f) Quantification of immunofluorescence staining of wild type (WT), NSE/IL-6, PGC-1α and IL-6:MCK/PGC-1α (PGC1α:IL-6) soleus muscles immunolabeled with a mouse anti-myosin slow antibody at 6 months of age. Data are represented as average ± SEM. n = 3, * p< 0.05. Statistical significance assessed by Mann–Whitney Rank Sum Test. (g,h) Physiological properties of soleus muscle from 6-month-old wild type (WT), NSE/IL-6, PGC-1α and IL-6:MCK/PGC-1α (PGC1α:IL-6) mice: Tetanic force and Specific force. Data are represented as average ± SEM. n = 8; * p < 0.05, ** p < 0.01, **** p < 0.0001. Statistical significance assessed by unpaired Student’s t-test.

