Figure 2.
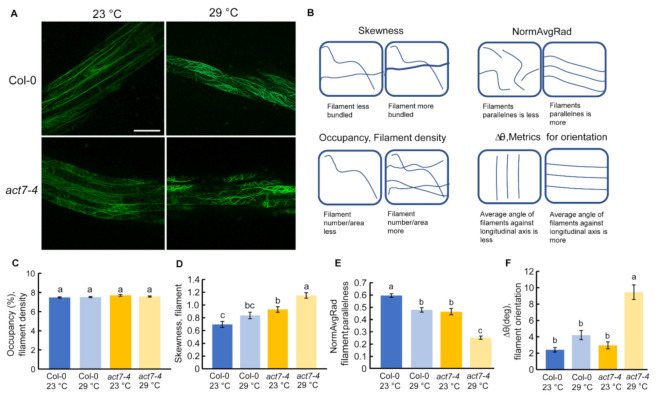
Effect of prolonged moderate-high temperature stress on cellular actin organization in Col-0 and act7-4. (A) Confocal images of ABD2-GFP and act7-4 ABD2-GFP at 23 and 29 °C (Bars = 50 µm). (B) Schematic representation of quantified actin parameters. Quantification of actin filaments (C–F). (C) Percent occupancy, (D) Skewness, (E) NormAvgRad, and (F) ∆θ in degree. Five-day-old seedlings were transferred to new agar plates and subjected to high-temperature (29 °C) and control temperature (23 °C) treatment for 3 days under light condition. Vertical bars represent mean ± SE of the experimental means from at least three independent experiments (n = 3 or more), where experimental means were obtained from 30 to 50 cells. Comparisons between multiple groups were performed by analysis of variance (ANOVA) followed by the Tukey–Kramer test. The same letter indicates no significant differences (p < 0.05).

