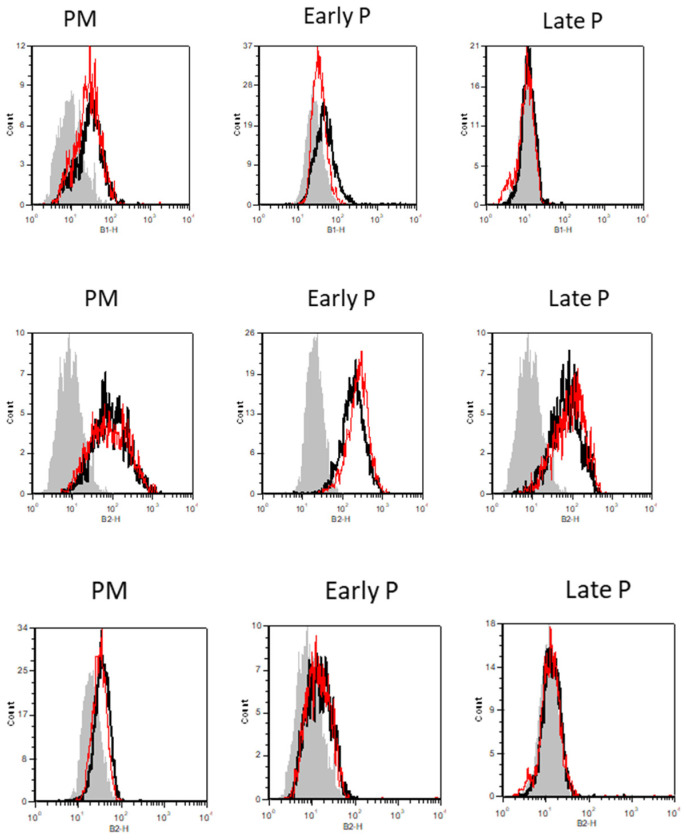
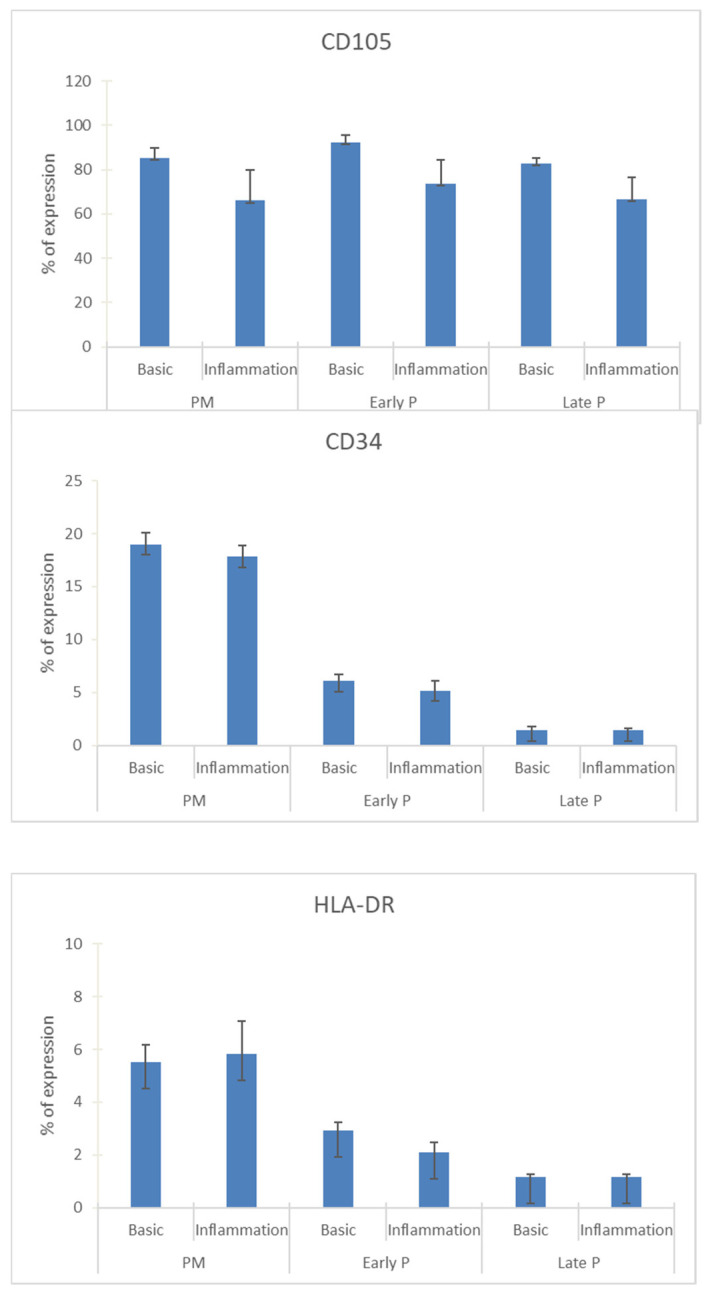
Figure 2.
The expression profile of CD34, CD105 and HLA-Dr during cell expansion of MSCs. These markers were analyzed by flow cytometry. The results are presented in the graphic as the mean ± SEM percentage of each marker expression. Representative FACS histograms are also shown for basic (black curve) and inflammation conditions (red curve) during PM, early and late passage cultures. The grey curve represents the antibody control.


