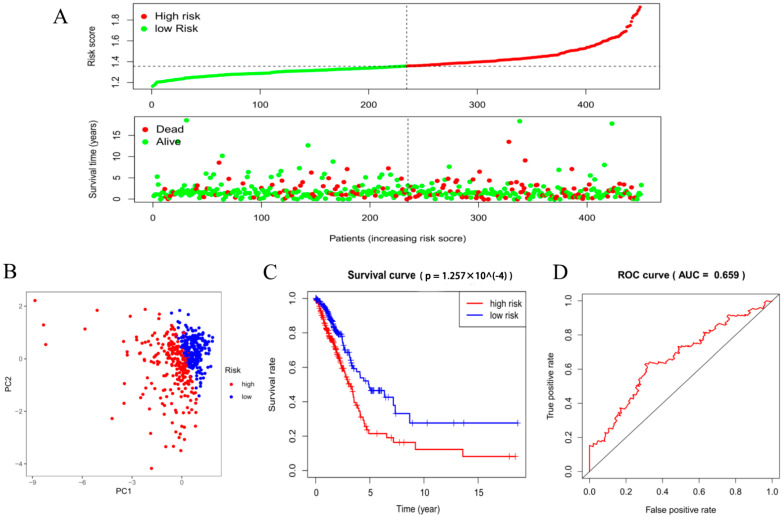
Figure 3.
Analysis of the survival risk signature for LUAD patients. (A) The risk score curve of each sample in the LUAD dataset of the TCGA database. (B) PCA based on the median grouping of risk scores. (C) Kaplan–Meier survival analysis curve of the high- and low-risk groups. (D) The constructed ROC curve evaluates the predictive efficiency of the risk signature for the survival rate of LUAD patients, AUC = 0.659.

