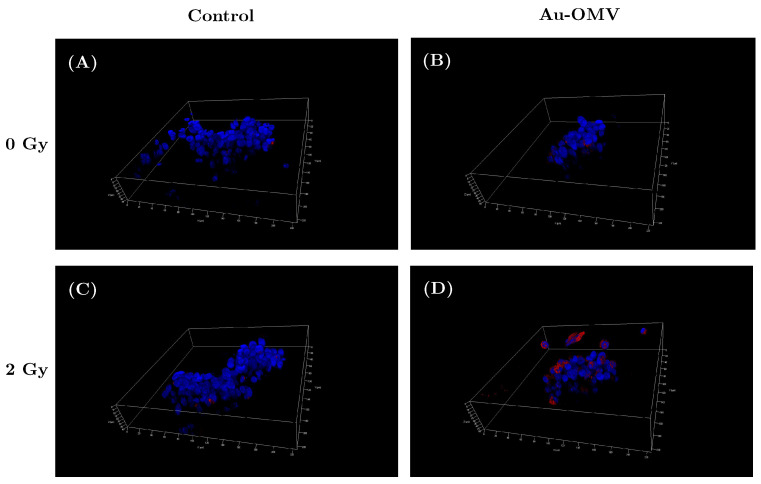
Figure 6.
ROS production of live G261 glioma cells grown on 3D spheres in control (A), in response to (B) Au–OMV, (C) 2-Gy radiotherapy, and (D) the combination of Au–OMV and radiotherapy under confocal microscopy. The live cells were labeled with H33342/DAPI (blue for nucleus), phalloidin (green for actin), and CellROXTM Deep Red Reagent for oxidative stress detection (pink for ROS).

