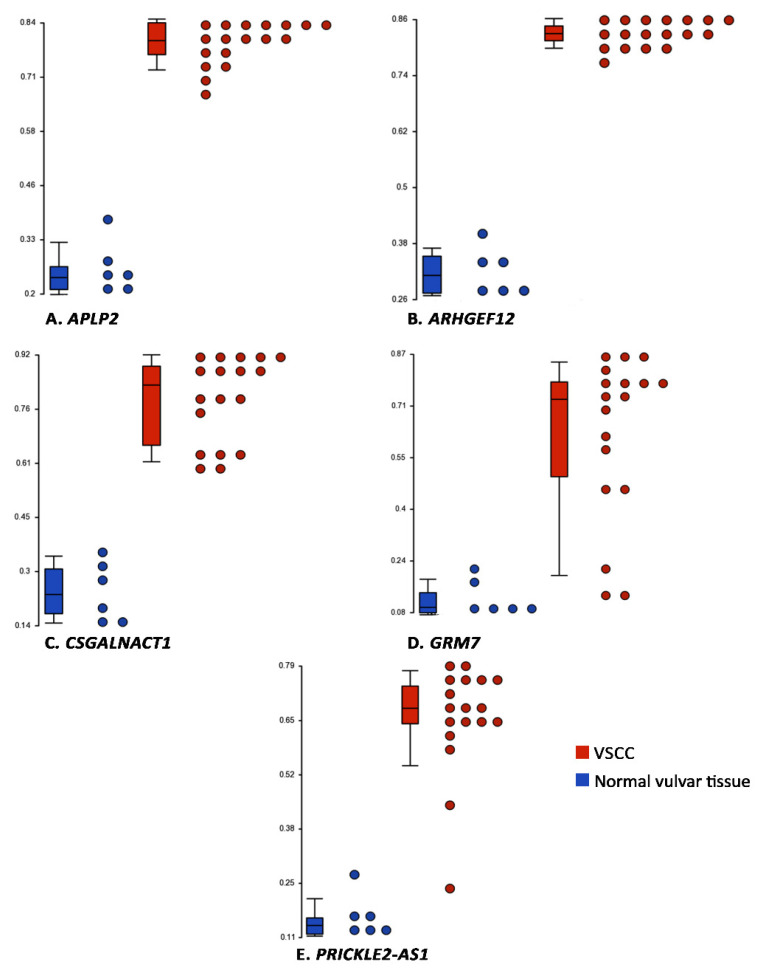
Figure 5.
Box-plots depicting the range of β-values in normal vulvar tissues and VSCC, for the 5 genes that had a deletion in one allele and hyper-methylation in another allele. The y-axes indicate the β-values, horizontal lines in the boxes represent the medians, and the whiskers represent the 5th and 95th percentiles.

