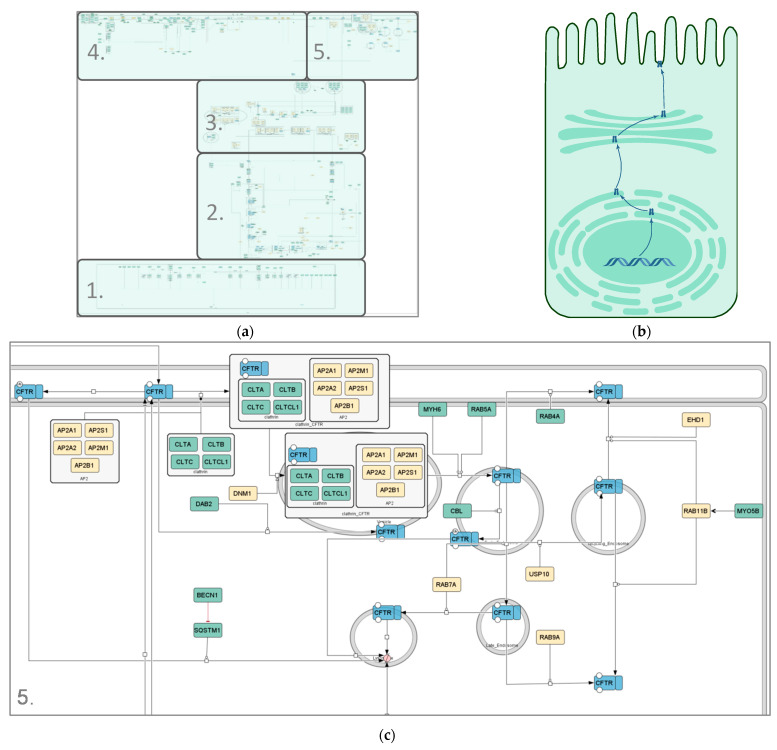
Figure 2.
Different representations of the CFTR lifecycle. (a) Image of the SBGN-compliant manually curated CFTR lifecycle core map; (b) cartoon representation of the CFTR lifecycle in an apical epithelial cell; (c) zoomed-in section of the endocytosis pathway in the manually curated CFTR lifecycle core map (submap 5). Compartments are depicted in grey, CFTR in blue and interactors in differing shades of green and yellow. The green color scheme represents interactors identified in at least one polarized cell line; yellow interactors were identified in non-polarized cell lines only. State transitions, catalysis and positive influences are shown in black; negative influences and inhibitions are displayed in red. Different shapes represent different kinds of interactors. Rounded rectangles correspond to proteins, ovals and circles to small molecules and ions, respectively, rectangles correspond to genes, rhomboids to RNA molecules and chevron shapes to receptors. The map was created using CellDesigner4.4.2.

