Figure 3.
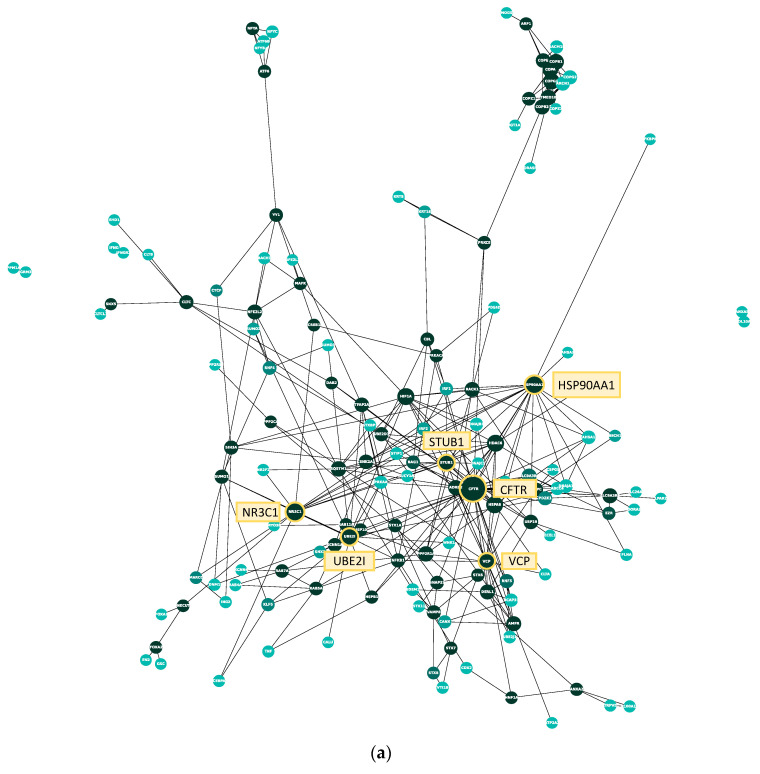
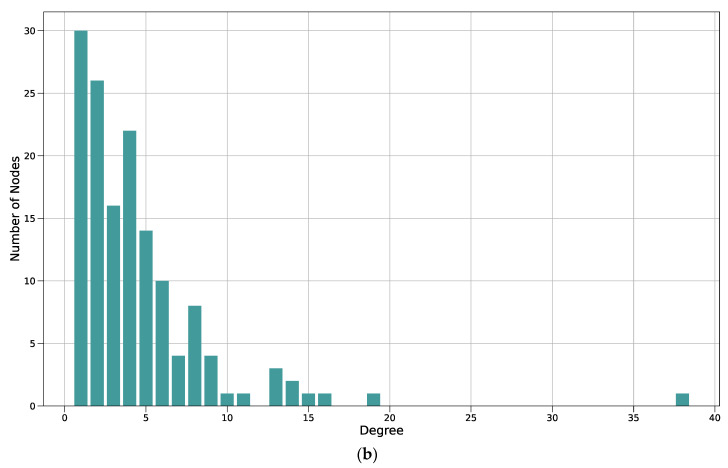
Protein–protein interaction network and degree distribution of the manual CFTR map. (a) Each node represents one protein, each edge between them a physical interaction shown in a small-scale study and reported on BioGrid. The larger a node, the higher its degree (i.e., the more interactions it shares with other proteins). CFTR and the five proteins with the next-highest degree are marked in yellow. The color of the protein represents its betweenness centrality, which is a measure of how important the node is to the flow of information through the CFTR Lifecycle Map. The betweenness centrality of a protein is the number of times it lies on the shortest path between two other proteins. The darker the node, the higher its betweenness centrality; (b) bar plot of the degree distribution of the protein–protein interaction network in A. The x-axis shows the degree of a protein; the degree is the number of other proteins a protein interacts with. The y-axis shows the number of proteins in the network with a certain degree. For example, the number of proteins that interact with only one other protein in the network (i.e., have a degree of 1) is 30, the number of proteins that interact with six other proteins is ten. The node with the highest degree (38) is CFTR.


