Figure 5.
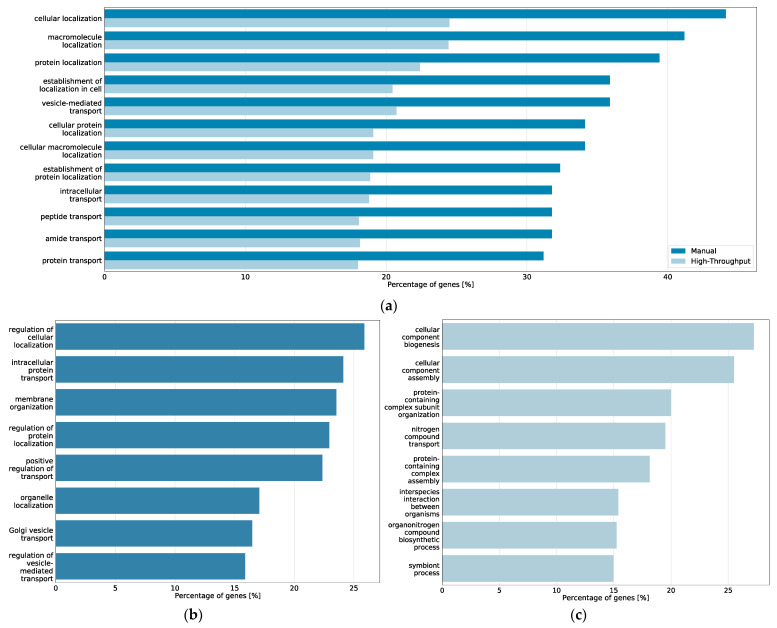
Top 20 prioritized Gene Ontology processes from BioInfoMiner analysis of the CFTR Lifecycle Map. (a) Bar plot of the processes prioritized among the top 20 in both the core map and the coarse map datasets and percentage of genes from the respective map associated with the processes; (b) bar plot of the processes prioritized among the top 20 in only the manually curated gene list of the core map and percentage of genes from the core map associated with the processes; (c) bar plot of the processes prioritized among the top 20 in only the high-throughput interactome of the coarse map and percentage of genes from the coarse map associated with the processes.

