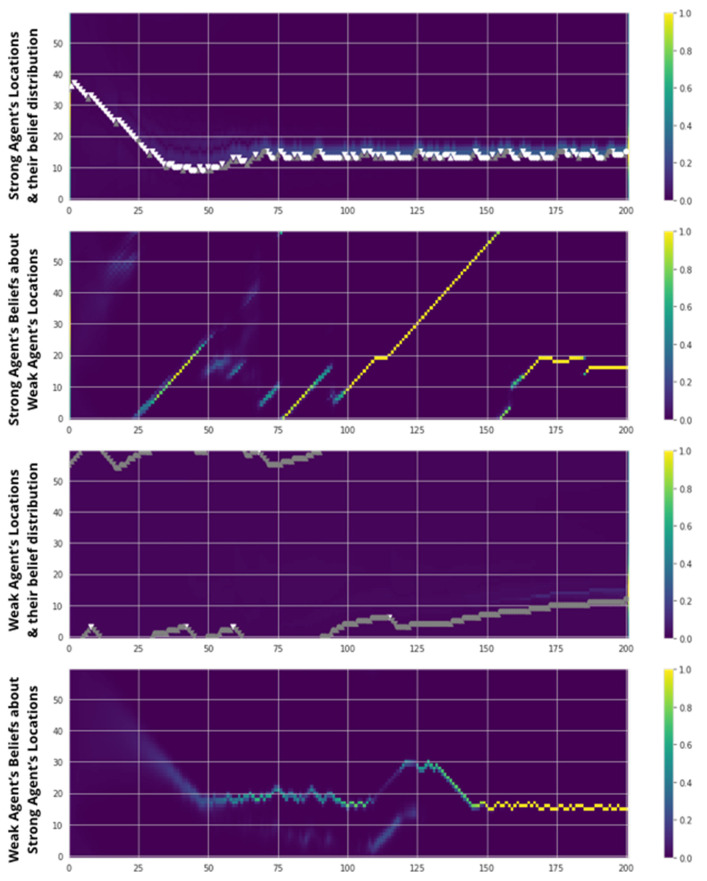
Figure 7.
Results from a single run of Model 4 over 200 epochs. Agents’ Shared Target position is set at location 15. Actual agent positions are illustrated as single dots for each epoch on the top graph, colored white when s = 1 and gray when s = 0. The background of the top graphs plots the agents’ belief distribution of their own position, from dark blue (0) to bright yellow (1). The bottom graphs plot the agents’ belief distribution of their partner’s position, on the same scale.

