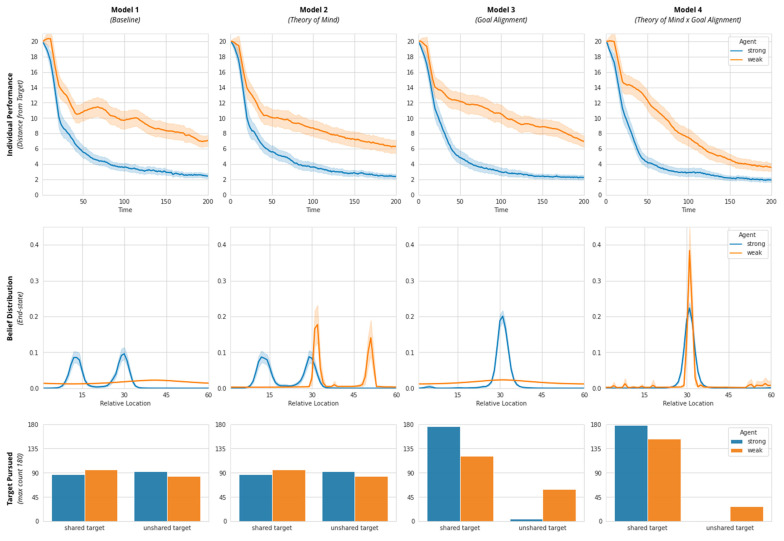
Figure 8.
Simulation results of Agent A (strong; blue) and Agent B (weak; orange) in all four models. Row 1: Individual performance as time taken to reach a target position. Row 2: End state belief distribution of target location (Shared Target = 30; A’s Target = 15; B’s Target = 45). Row 3: Distribution of targets pursued in 180 runs.

