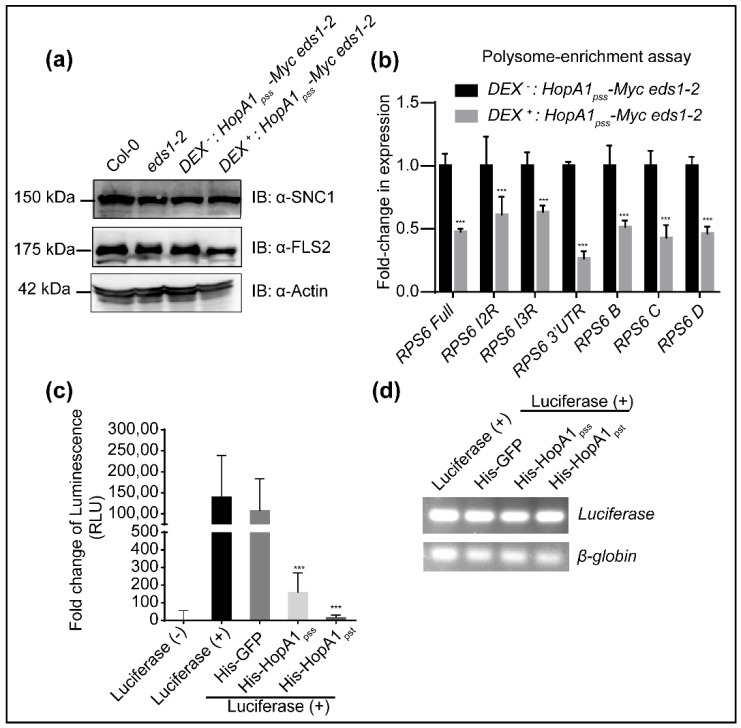
Figure 6.
HopA1s display translational suppression activity. (a) Expression levels of SNC1 and FLS2 proteins in Col-0, eds1-2, Dex− and Dex+ HopA1pss-expressing transgenic plants at 12 hpin. Immunoblots were performed with anti-SNC1, anti-FLS2 or with anti-actin as representative of loading control. (b) Transcript levels of RPS6 AS variants enriched on polysomes during ETIHopA1pss-like response. Values are mean ± SD of three replicates and shown as relative to Dex− levels. Statistical analysis is with pairwise comparison to Dex− or Luciferase (-) samples by Student’s t-test (*** p < 0.001). (c) HopA1pss and HopA1pst suppress reporter gene expression in in vitro transcription-translation coupled assay system. Luciferase (LUC) activity in the presence of equimolar amounts of His-HopA1pss, His-HopA1pst or His-GFP (negative control). (d) Semi-quantitative qRT-PCR of LUC and control β-globin expression in the above samples.

