Figure 3.
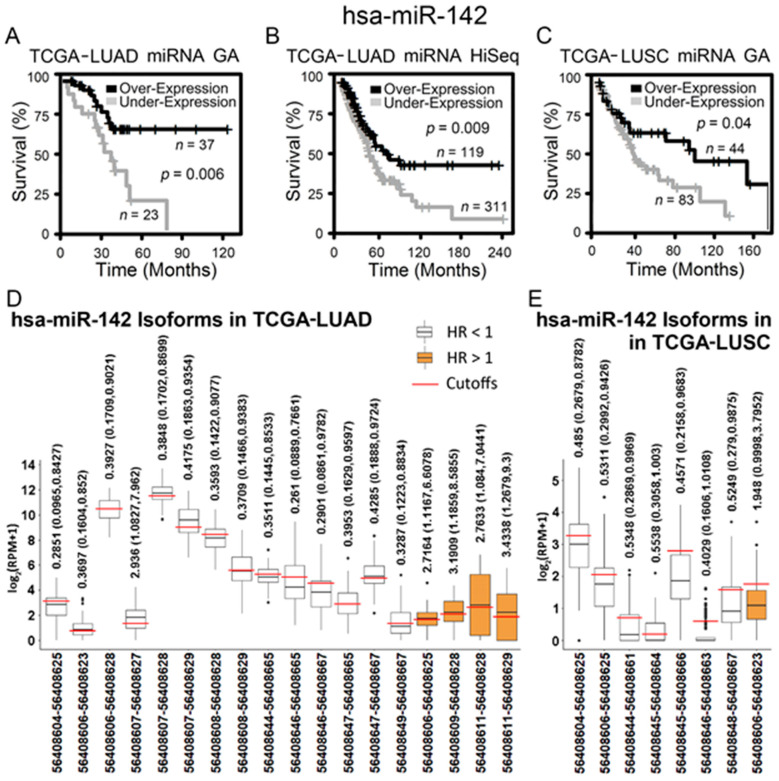
RNA-sequencing data of hsa-miR-142 and its isoforms in The Cancer Genome Atlas lung adenocarcinoma (TCGA-LUAD) and lung squamous cell carcinoma (TCGA-LUSC) patient cohorts. (A–C) Kaplan–Meier analysis of patient tumors grouped by hsa-miR-142 differential expression in TCGA-LUAD and TCGA-LUSC. When hsa-miR-142 was overexpressed, patients survived for a significantly longer period of time. The cutoff points of hsa-miR-142 overexpression and underexpression were: (A) miRNA cutoff = 12.5 in TCGA-LUAD GenomeAnalyzer (GA), (B) miRNA cutoff = 11.7 in TCGA-LUAD HiSeq, and (C) miRNA cutoff = 13.1 in TCGA-LUSC GenomeAnalyzer (GA). (D,E) The expression of hsa-miR-142 isoforms (with positions in chromosome 17 according to Human Genome 19 (hg19)) that had a significant hazard ratio (HR) in patient groups of overexpression versus underexpression in TCGA-LUAD (D) and TCGA-LUSC (E). Each isoform had a specific expression cutoff point to generate the corresponding HR shown in the figure.

