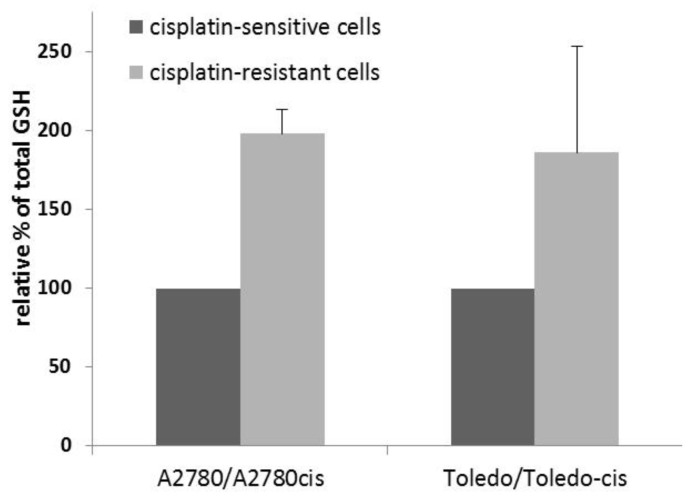
Figure 2.
Relative total glutathione content in cells with different sensitivity to cisplatin; a colorimetric assay. The absorbance determining the glutathione concentration in cells of the sensitive lines was taken as 100% and the corresponding value for resistant lines was calculated in relation to it. Bars show the mean ± SD values from three separate measurements.

