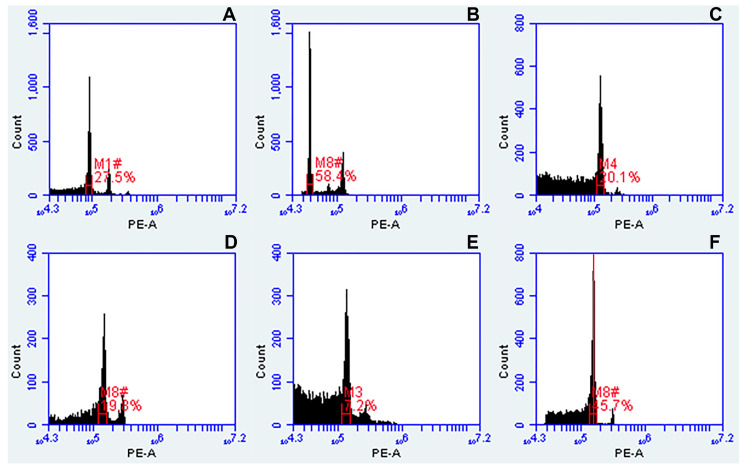
Figure 2.
Optimization of flow cytometry assay for dried leaf samples. (A) Three gradually declined peaks of diploid U. decumbens CIAT 26185 indicating endoreduplication; (B) additional high peak in histogram of tetraploid U. maxima CIAT 16055, indicating contamination of leaf sample; (C) fresh and (D) dried leaf samples of Panicum miliaceum showing the same position of peaks in histograms, but slight differences in number of nuclei and CV of DNA peaks; (E) histogram of dried leaf sample of Panicum miliaceum with no gating tools applied; (F) histogram of dried leaf sample of Panicum miliaceum where gating tools were applied, giving sharp peaks and low background. Here, gain or peak height was adjusted using a software function (VirtualGain) and the center of the peak selected as reference point (red line; Peak Definition Marker). Regions of identification (red marks) were placed across the peaks to export fluorescence values representing peak positions and CVs (coefficient of variation of G0/G1 peaks).

