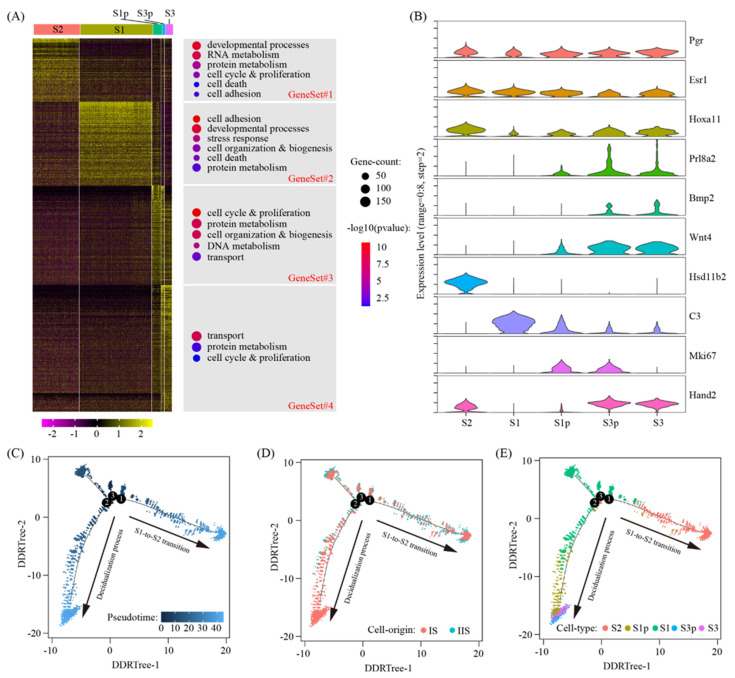
Figure 3.
Sub-cluster analysis of stromal cells. (A) Heatmap of gene expression signatures for all stromal cell sub-clusters (left). All signature genes were divided into 4 gene sets and enriched gene ontology terms were assigned accordingly (right). (B) The expression pattern of marker genes for sub-clusters of stromal cells using violin plot. Shown were pan-stromal cell markers (Pgr, Esr1 and Hoxa11), decidual cell markers (Prl8a2, Wnt4 and Bmp2) and gene set reprehensive genes (Hsd11b2 for #1, C3 for #2, Mki67 for #3 and Hand2 for #4). (C–E) Pseudotime ordering of stromal cells. The distribution of pseudotime (C), cell origin (D) and cell type (E) across the reconstructed trajectory were displayed.

