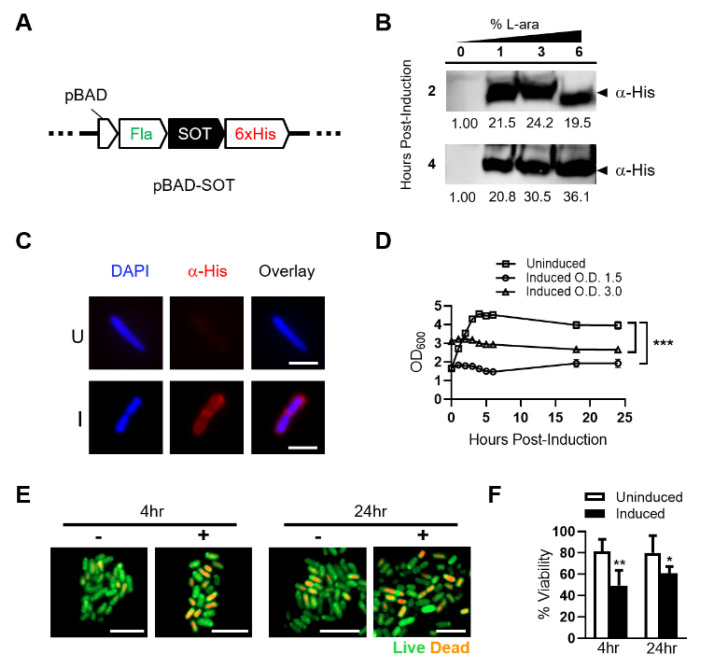
Figure 1.
Expression, subcellular localization and toxicity of SOT in attenuated ST. (A) Schematic of inducible pBAD construct (pBAD-SOT) integrating ampicillin resistance with N-terminal flagellin (Fla) fusion and C-terminal 6XHis tag fusion to SOT for downstream analyses. (B) Attenuated ST transformed with the pBAD-SOT construct was cultured in Luria Broth (LB) containing 0% (uninduced) or 1–6% (induced) L-arabinose for up to 4 h at 37 °C. Bacterial cell lysates from ~5 × 10⁷ colony forming units (CFUs) at each time point for each L-arabinose concentration were run on a 4–20% polyacrylamide gradient gel and subjected to Western blot analysis against a His-tag fused to the C-terminus of SOT (α-His). Predicted SOT fusion size ~31 kDa (arrow). Band densitometries are shown under blots relative to uninduced. (C) ST-SOT was cultured in LB media containing 2% L-arabinose for 1 h and then immunostained (α-His) to determine subcellular localization of SOT (red). Nuclei are stained with DAPI (blue). Representative images shown. Scale bar = 10 µm. (D) Growth curve of ST-SOT post-induction. Optical density readings (OD600) for uninduced and induced (2% L-ara) ST-SOT cultures were measured over 24 h. Uninduced and induced cultures were done in triplicate and error bars represent standard error of the mean. Growth curves of uninduced and induced are compared. *** p < 0.001, two-way ANOVA. (E) ST-SOT under uninduced and induced conditions were stained at indicated time points with acridine orange (live, green) and ethidium bromide (dead, orange) and imaged by fluorescence microscopy at 100× magnification. Scale bar = 5 µm. (F) Percent viability of ST-SOT under uninduced and induced conditions at indicated time points based on live/dead staining from six random fields at 100× magnification. * p < 0.05, ** p < 0.01, t-test. Experiments performed ≥2 times.

