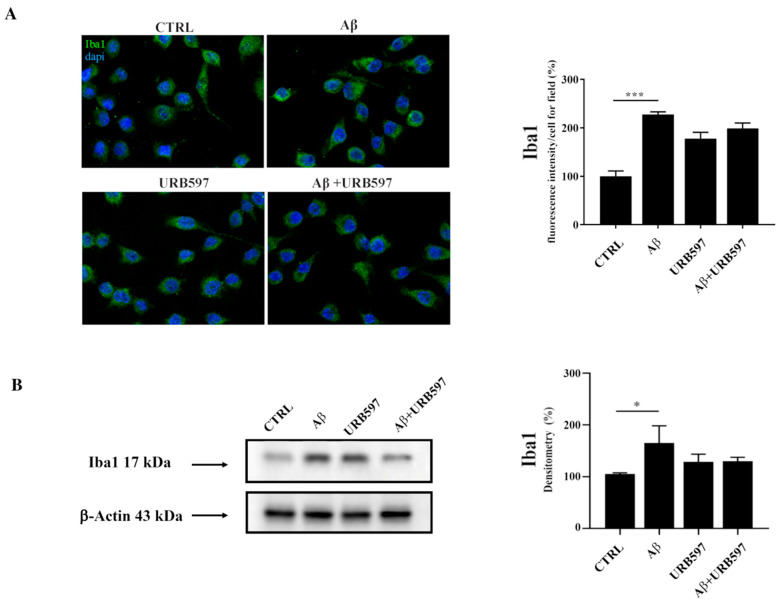
Figure 1.
(A) Immunofluorescence analysis of Iba1 in BV-2 cells treated with 30 μM Aβ25–35 for 24 h. Quantization of the intensity of the fluorescence signal was performed using the ImageJ software. The results are expressed as the mean ± SD of three independent experiments. *** p < 0.001. Bar 20 μm; (B) Determination of Iba1 protein levels by western blot. The data were normalized to the β-actin signal, reported as percentage versus control (CTRL). Data are expressed as the mean ± SEM of three independent experiments. * p < 0.05.

