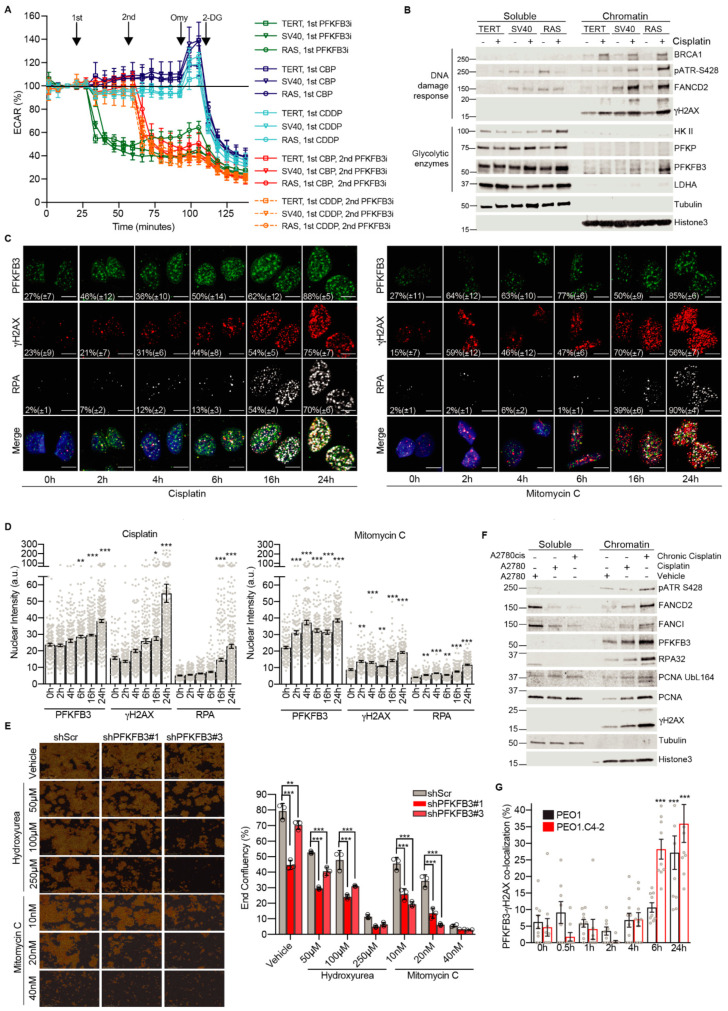
Figure 2.
Cancer-specific PFKFB3 nuclear localization in response to FA pathway activation. (A) Extracellular acidification rate (ECAR) in BJ fibroblast transformation series; TERT (non-malignant), SV40 and RAS (malignant) cell lines. Cells were treated with either PFKFB3i (10 µM), carboplatin (CBP, 100 µM), or cisplatin (CDDP, 100 µM) at indicated time points, all samples were treated with 2 µM Oligomycin (Omy) to obtain maximal ECAR capacity and subsequently with 20 mM 2-deoxy glucose (2-DG) for a complete block of glycolysis. Data displayed as mean values at each time point ± S.D, n = 5. (B) Isolation of whole cell soluble and chromatin-bound proteins by fractionation and immunoblotting of BJ hTERT, SV40, and RAS cells treated with vehicle or 2.5 µM cisplatin for 24 h. Tubulin was used as a control for the soluble fraction and Histone 3 as a control for the chromatin-associated fraction. Representative blot of n > 3 experiments. Images of the uncropped western blots can be found in Figure S8. (C) Representative images of PFKFB3, γH2AX, and RPA32 nuclear recruitment kinetics upon treatment with cisplatin (10 µM) or Mitomycin C (360 nM) in U2OS cells. Cells were fixed at indicated time points post-treatment and immunostained. Data are represented as percentage of foci-positive cells ± S.D, representative of n = 2 independent experiments per treatment, n > 100 cells per condition. Quantification of the percentage of foci-positive cells was determined using CellProfiler by counting cells containing treatment-induced foci above the average of untreated (0 h) sample, scale bar of 10 µm. (D) Image-based quantification of PFKFB3, γH2AX, and RPA32 nuclear staining intensity in (C). Quantification was performed with CellProfiler. Single cell data displayed as individual points with bar graphs showing mean ± S.E.M. Representative of n = 2 experiments, n > 100 cells per time-point, n > 100 cells/treatment. * p < 0.05, ** p < 0.01, *** p < 0.001; ordinary one-way ANOVA analysis, Dunnett’s test for multiple comparisons. (E) Cell proliferation of A2780 cells expressing shScramble (SCR), shPFKFB3#1 or shPFKFB3#3 and treated as indicated for 7 days. On the left, representative images of fields used to calculate end-point confluency, images acquired with 10× microscope magnification from Incucyte® SX5 Live-Cell Analysis System. To the right, the measurement of end-point confluency after treatment exposure. Data represent mean ± SD of triplicates, each replicate determined by mean of n = 4 images; ** p < 0.01, *** p < 0.001; one-way ANOVA analysis, Sidak’s test for multiple comparisons. (F) A2780 cell left untreated or treated with 2.5 µM cisplatin for 24 h and A2780cis cultured in 2.5 µM cisplatin were subjected to cell fractionations for isolation of whole cell soluble and chromatin-bound proteins followed by immunoblotting. Representative blot of n > 3 experiments. Images of the uncropped western blots can be found in Figure S10. (G) Confocal analysis of PFKFB3 recruitment kinetics at DNA damage sites upon carboplatin treatment in PEO1 and PEO1.C4-2 isogenic cell lines. Each cell line was treated with corresponding carboplatin EC50 concentrations: 12.3 µM for PEO1 and 25 µM for PEO1.C4-2 cells. Quantification of the percentage of cells with PFKFB3 and γH2AX co-localizing nuclear foci was performed employing CellProfiler. Data displayed as means ± S.E.M, representative of n = 2 experiments, n > 100 cells per time-point, n > 100 cells/treatment. *** p <0.001; ordinary one-way ANOVA, Dunnett’s test for multiple comparisons.

