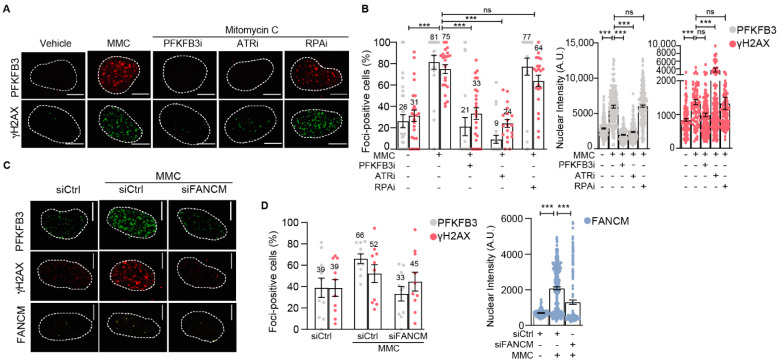
Figure 3.
PFKFB3 requires ATR kinase activity for its nuclear recruitment to repair ICL-induced damage in replicating cells. (A) Representative confocal images of PFKFB3 and γH2AX foci in U2OS cells synchronized at the G1/S boundary and released for 3 h in Mitomycin C (MMC, 360 nM) with or without PFKFB3i (10 µM), ATRi (2.5 µM), or RPAi (50 µM), n ≥ 2 independent experiments. Dotted lines indicate the nuclear border. Scale bar, 10 μm. (B) Scatter dot plot with bar charts of percentage PFKFB3 and γH2AX foci positive cells upon image-based analysis of (A). Left panel shows the percentage of cells containing number of nuclear foci above the average in vehicle, data displayed as means ± S.E.M, one data point represents foci-positive percentage per image. Right graphs show nuclear intensity of PFKFB3 and γH2AX stainings, data displayed as scatter dot plot with means ± S.E.M, one data point represents one cell. n ≥ 2 independent experiments, n > 100 cells per condition. *** p < 0.001; ordinary one-way ANOVA, Sidak’s test for multiple comparisons. (C) Representative confocal images of FANCM, PFKFB3, and γH2AX foci in U2OS cells treated with siFANCM or siControl for 24 h, followed by cell cycle synchronization at the G1/S boundary and released into S-phase for 3 h in Mitomycin C (MMC, 360 nM) or left untreated, n > 2 independent experiments. Scale bar, 10 μm. (D) Quantification of FANCM, PFKFB3, and γH2AX from (C) using CellProfiler. Left panel depicts the percentage of cells containing number of nuclear foci above the average in vehicle, data displayed as means ± S.E.M, one data point represents foci-positive percentage per picture. Right graph shows nuclear integrated intensity of FANCM. Data displayed as scatter dot plot with means ± S.E.M, one data point represents one cell. n > 2 independent experiments, n > 100 cells per condition. *** p < 0.001; ordinary one-way ANOVA, Sidak’s test for multiple comparisons.

