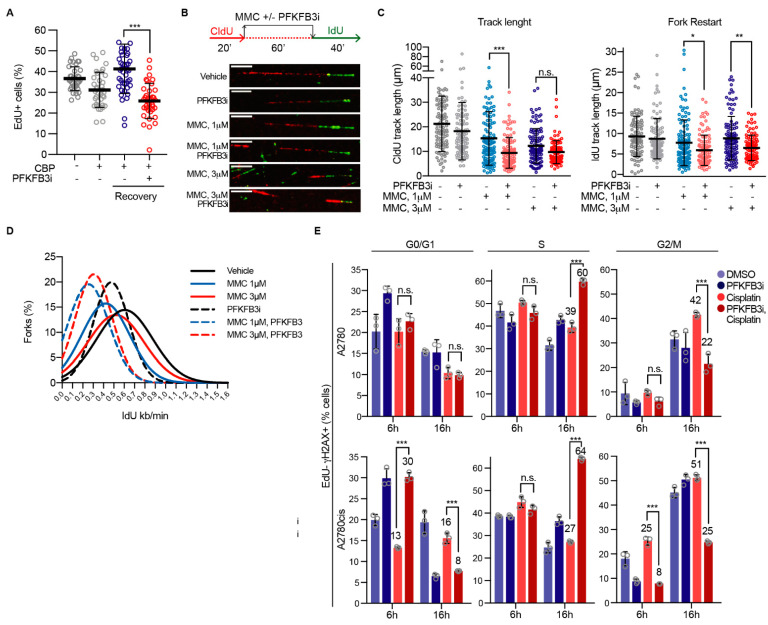
Figure 5.
PFKFB3 inhibition impairs replication fork restart eliciting a FA-like phenotype in replicating cells. (A) Quantification of percentage of EdU positive A2780 cells. Cells were treated with carboplatin (CBP, 50 µM) for 20 h, followed by co-treatment with PFKFB3 inhibition (PFKFB3i, 10 µM) for 4 h. Cells were then released into normal media for 24 h, and pulse-labelled with 10 μM EdU for 30 min prior fixation. Cells were immunostained, subjected to confocal imaging, and EdU intensities were quantified using CellProfiler. EdU-positive threshold was established by the EdU intensity levels from the untreated sample. Data shown as means ± S.D., where each data point represents percentage of cells per picture, n = 2. *** p < 0.001; Mann–Whitney test. (B) A2780 cells were analyzed for replication fork restart. Shown is a schematic representation of the experimental setup and representative images of replication tracks for each condition. Cells were labeled with DNA analogs, CldU for 20 min followed by 60 min treatment with indicated concentrations of Mitomycin C (MMC) with or without PFKFB3 inhibition (B3i, 10 μM) and then IdU for 40 min. DNA fibers were prepared and visualized by immunofluorescence detection of CldU and IdU. Scale bar, 10 μm. (C) Fiber track length measurement from (B). Left panel shows mean CldU track lengths, right panel displays fork restart as mean IdU track lengths. One data point represents track length of a single fork, data are displayed as scatter dot plots with means ± S.D. of n > 100 forks per condition, representative experiment of n = 2, * p < 0.05, ** p < 0.01, *** p < 0.001; ordinary one-way ANOVA analysis, Tukey’s test for multiple comparisons. (D) Distribution of fork speed upon replication fork restart in cells in (B), n > 100 restarted forks per condition, representative experiment of n = 2. (E) Cell cycle analysis of EdU-γH2AX double positive A2780 and A2780cis cells. After cell cycle synchronization with aphidicolin (6 µM) for 24 h, cells were pulsed with EdU for 30 min and then released into cisplatin (10 µM) with or without PFKFB3i (5 µM) or left untreated for either 6 h or 16 h prior fixation. Data displayed as means ± SD of n > 20,000 events, representative experiment of n = 2, *** p < 0.001; ordinary one-way ANOVA analysis, Tukey’s test for multiple comparisons.

