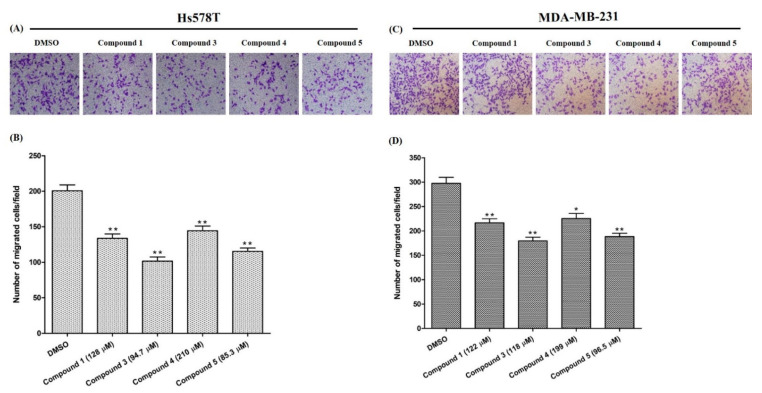
Figure 4.
Attenuation of TNBC cell migration. (A,C): visualized migrated cells after treating with compounds. (B,D): the migrated cells stained with crystal violet, and photographs taken for the inhibition calculation. The results are presented as the mean ± SD of three independent experiments. Bars with asterisks indicate significant differences from the control at p ≤ 0.05 (*) or p ≤ 0.01 (**).

