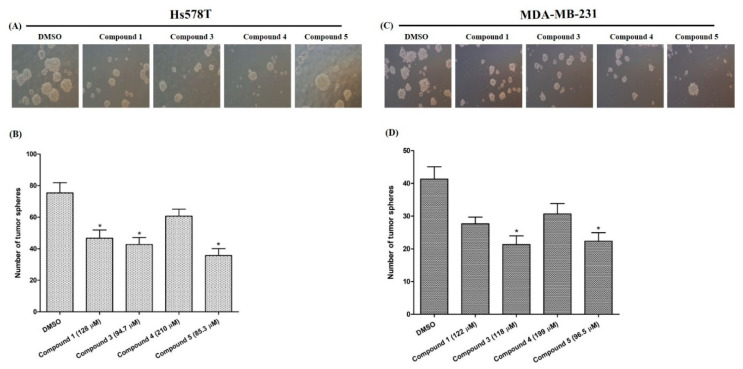
Figure 5.
Reduction of the formation of the tumor-sphere. (A,C): the captured tumor-spheres after five days of treatment with tested compounds. (B,D): the number of tumor-spheres. Data are presented as the mean ± SD of three independent experiments. The bars with asterisks indicate significant differences from the control at p ≤ 0.05 (*).

