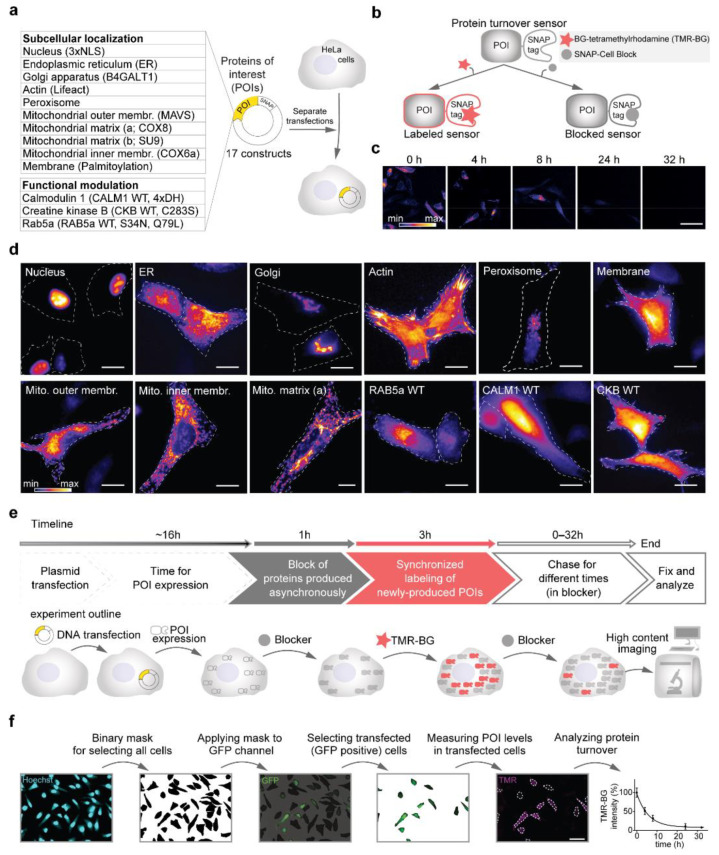
Figure 1.
Setting up a workflow for the optical analysis of protein turnover. (a) SNAP-tag turnover sensors (Table 1, Supplementary Table S1) were cloned in a pcDNA3.1(+) backbone. In total, 17 constructs were transfected separately into HeLa cells for measuring their turnover. (b) The SNAP-tags, fused to the turnover sensors, covalently bind to O6-Benzylguanine derivatives of either fluorescent dyes (such as TMR-BG in this work) or to a non-fluorescent ligand, here behaving as a ‘blocker’ (SNAP-Cell Block). (c) Labeled sensors can be chased over time for their turnover. (d) Representative images of the SNAP-tag turnover sensors expressed in HeLa cells and pulse-labeled for 30 min with TMR-BG. (e) Experimental pulse-chase workflow for measuring protein turnover. (f) Image analysis workflow. Scale bars 50 μm (c,f) and 20 μm (d).

