Figure 2.
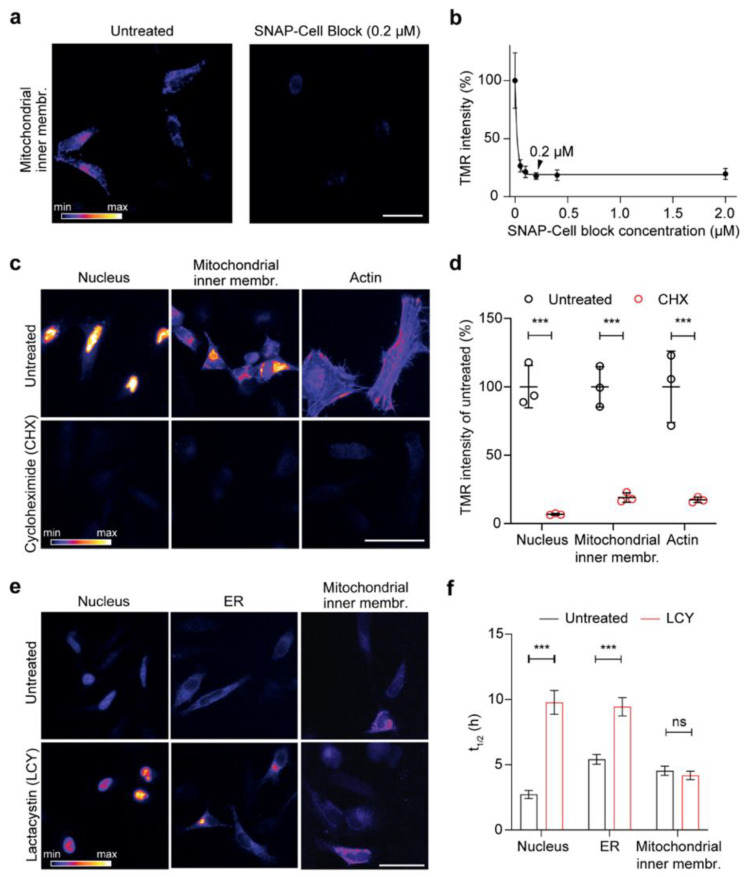
Testing the reliability of the assay for the optical analysis of protein turnover. (a) Representative images of cells expressing the mitochondrial inner membrane construct, either blocked with SNAP-Cell Block for 1 h or left untreated, followed by a 10 min pulse with SNAP-Cell TMR-BG. (b) Similar approach as in (a) with different concentrations of SNAP-Cell Block revealing a significant drop in TMR-BG intensity. The black arrowhead shows the selected concentration for further experiments (0.2 µM, representative image shown in (a). (c) Representative images of cells expressing NLS, mitochondrial inner membrane, and actin (Lifeact) constructs, blocked with SNAP-Cell Block for 1 h, followed by a 3-h pulse in the absence (untreated control) or the presence of cycloheximide (CHX, blocking protein synthesis). (d) Image intensity quantification in 75 images revealing a drop in SNAP-TMR-BG intensity after the use of CHX compared to untreated cells for all three conditions. (e) Block of proteasome function with lactacystin (LCY) and respective quantifications (f), showing that inhibiting proteasome function increases the lifetime of SNAP targeted to the nucleus or the ER, but does not affect its mitochondrial turnover. The images (e) correspond to the time point at 4 h after the beginning of the chase, while the quantifications in (f) correspond to the lifetime calculation, fitting entire chase curves as in Figure 3 (see below). Scale bars: 50 µm (a,c), 25 µm (e). The data are presented as mean ± 95% confidence interval (CI) (b) or mean ± standard error of the mean (SEM) (d,f), n = 3. Two-way analysis of variance (ANOVA), post hoc Bonferroni test (d,f), ns-not significant, *** p < 0.001.

