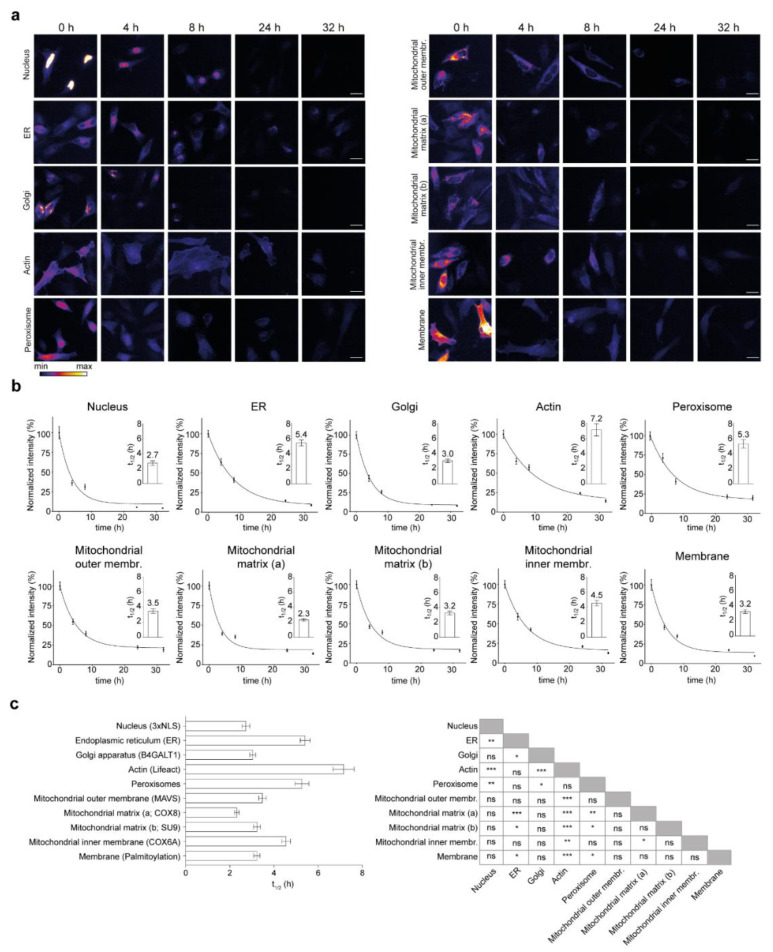
Figure 3.
Effect of subcellular localization on lifetime of the SNAP-tag constructs. (a) Representative images of the fluorescence signal intensity over time in the different SNAP-tag turnover sensors targeted to the different cellular locations. (b) The quantification of the TMR-BG signal intensities is always normalized to the 0 h time point. Exact values of the t1/2 are indicated in the insets. (c) All half-lives of the SNAP-tagged sensors with respective comparisons. Scale bars: 25 µm. The data are presented as mean ± 95% CI (b) or mean ± SEM ((b) insets, (c)), n = 3. One-way ANOVA, post hoc Bonferroni test (c), ns-not significant, * p < 0.05, ** p < 0.01, *** p < 0.001.

