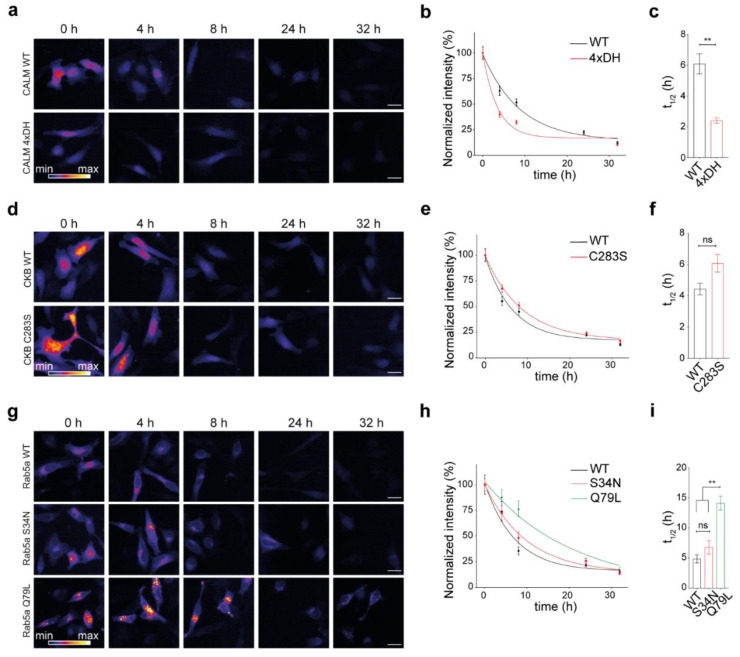
Figure 4.
Effect of protein activity on lifetimes for three representative proteins and their respective mutants. (a) Representative images of the fluorescence signal intensity over time in the fusion sensor combining the SNAP-tag with either calmodulin WT (CALM WT) or the calmodulin mutant unable to bind Ca2+(CALM1 4xDH). (b) The quantification of the TMR-BG intensity over time normalized to 0 h. (c) Calculated half-lives for (b). (d–f) as panels (a–c) for the turnover sensor creatine kinase B WT (CKB WT) and its kinase-dead mutant (CKB-C283S). (g–i) as panels (a–c) for the small GTPase Rab5a (WT) and its mutants S34N (inactive), and Q79L (constitutively active). Scale bars: 25 µm (a,d,g). The data are presented as mean ± 95% CI (b,e,h) or mean ± SEM (c,f,i), n = 3. Unpaired Student’s t-test (c,f), one-way ANOVA followed by post hoc Tukey’s test (i), ns-not significant, ** p < 0.01.

