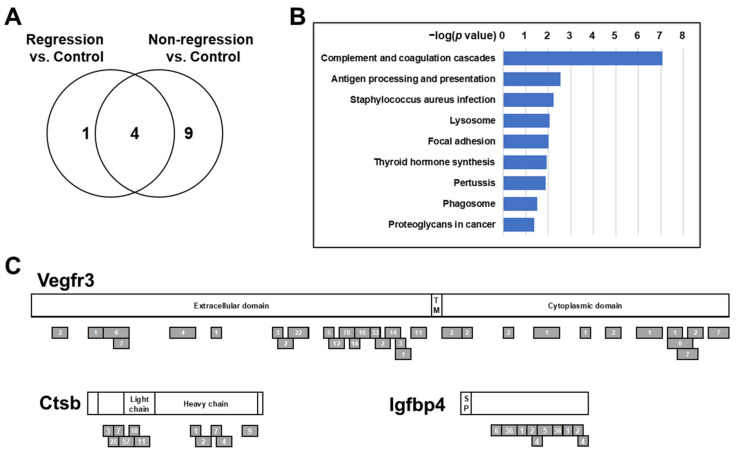
Figure 2.
Proteomic analysis of pretreatment plasmas from iKAP mice with complete tumor regression and with residual tumors. (A). Venn diagrams of pathways are significantly associated with more than a two-fold increase of proteins in the plasma of Regression mice or Non-regression mice compared to control mice. (B). Pathways uniquely identified in the comparison of Non-regression vs. control. p values were calculated by hypergeometric test. (C). Schema of mouse Vegfr3, Ctsb, and Igfbp4. Gray bars indicate peptides identified in mouse plasma. Numbers indicate mass spectra counts for each peptide. The amino acid sequences are based on P35917-1 for Vegfr3, P10605-1 for Ctsb, and P47879-1 for Igfbp4.

