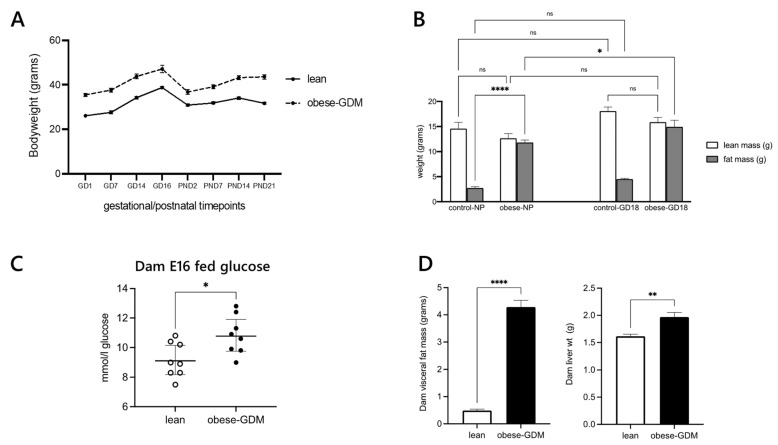
Figure 2.
Dam morphometric and metabolic status data. (Panel A) Body weight trajectory from pre-gestation to weaning; (B) a comparison of body composition prior to mating (NP) with E18 gestation; (C) fed blood glucose at day 18 of gestation; (D) maternal total dissected visceral fat weights and liver weights at the end of the study (postnatal day 21). Data are presented as ±SEM, n = 8 per group. Significant differences are denoted **** p < 0.001, ** p < 0.01, * p < 0.05. ns, not significant, i.e., p > 0.05.

