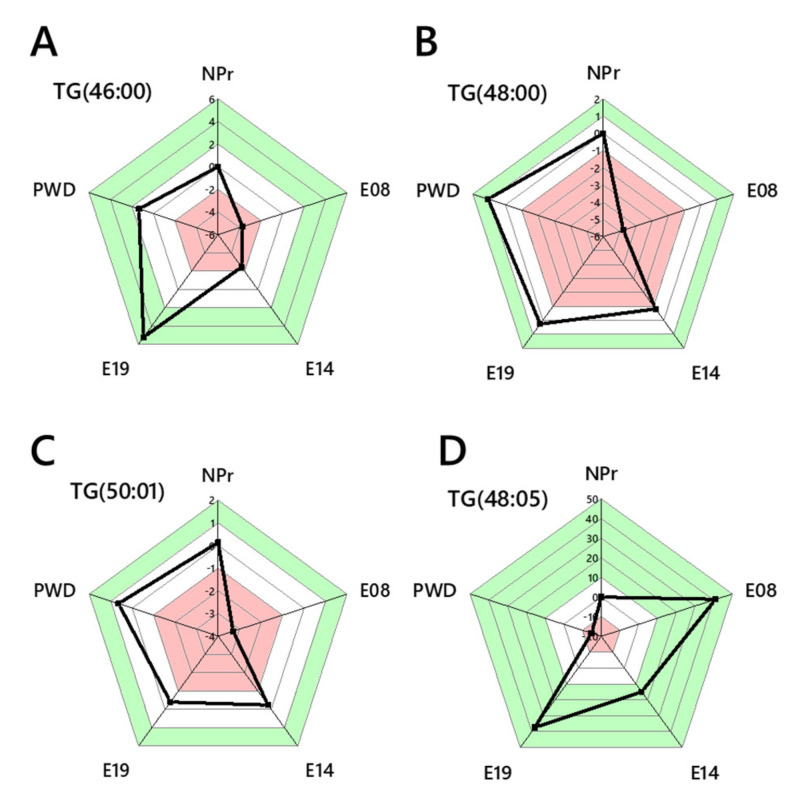
Figure 6.
Abundance analysis of TG variables measured at all time points. (Panel A) Abundance analysis of TG(46:0); (B) TG(48:0); (C) TG(50:1); (D) TG(48:5). Panels A–C represent TGs associated with de novo lipogenesis, whereas D represents those of mixed and/or dietary origin. NPr, not pregnant; E08, 8th day of pregnancy; E14, 14th day of pregnancy; E19, 19th day of pregnancy; PWD, post-weaning dam.

