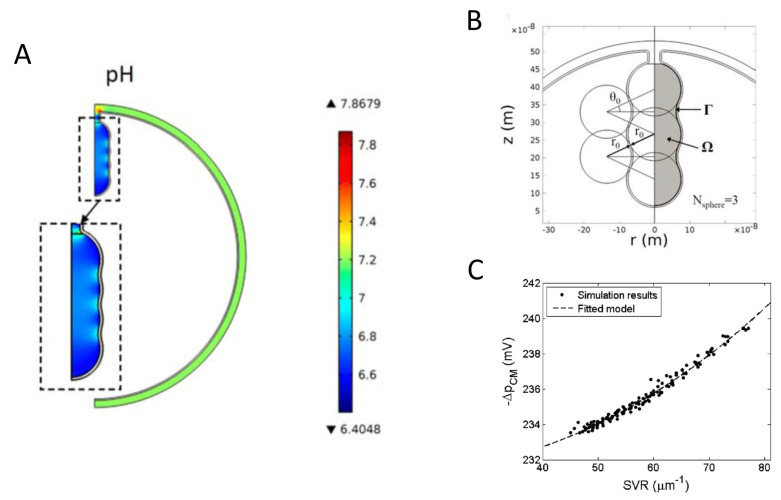
Figure 2.
Mitochondrial model with a single cristae. (A) Proton concentration distribution (expressed as pH) in the inner mitochondrial space (cristae and non-cristae portions). (B) Geometry used to investigate the effect of detailed cristae morphology. (C) Effect of the surface-to-volume ratio (SVR) on the average PMF on the cristae membrane (). Reproduced with permission from Song et al. [34], Phys. Rev. E; published by the APS, 2013.

