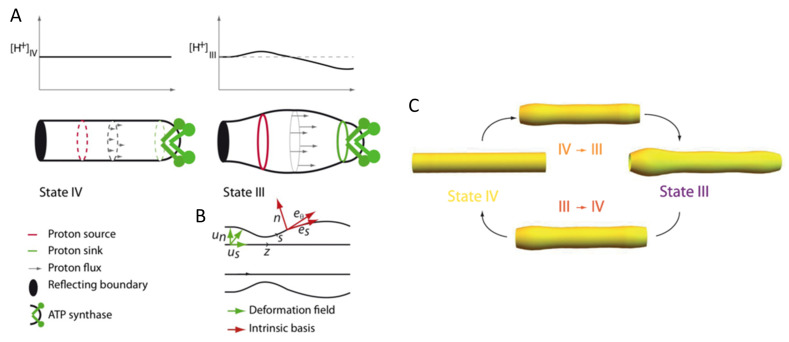
Figure 7.
Mitochondrial cristae modeled as an out-of-equilibrium membrane driven by a proton field. Schematic representation of a cristae: (A) The plots represent the proton concentration on the surface in states III and IV. The tubes represent the shape of the invagination in state III and IV; (B) Deformation fields of the membrane and intrinsic basis of the deformed surface. (C) Changes in the cylindrical shaped model cristae morphology as the mitochondrion transitions between the two mitochondrial states IV and III. Reproduced with permission from Patil et al. [94], Phys. Rev. E; published by the APS, 2020.

