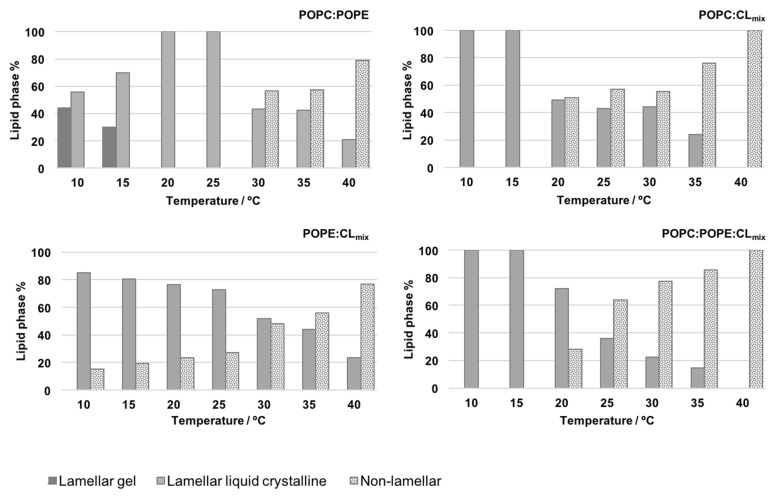
Figure 11.
Relative quantitative distribution of different lipid phases as function temperature of POPC/POPE (0.5:0.5), POPC/CLmix (0.7:0.3), POPE/CLmix (0.6:0.4) and POPC/POPE/CLmix (0.5:0.3:0.2) in the studied temperature range. pH 7.4, 0.1 mM NaCl. Reproduced with permission from Lopes et al. [144], Biochim. Biophys. Acta; published by Elsevier, 2017.

