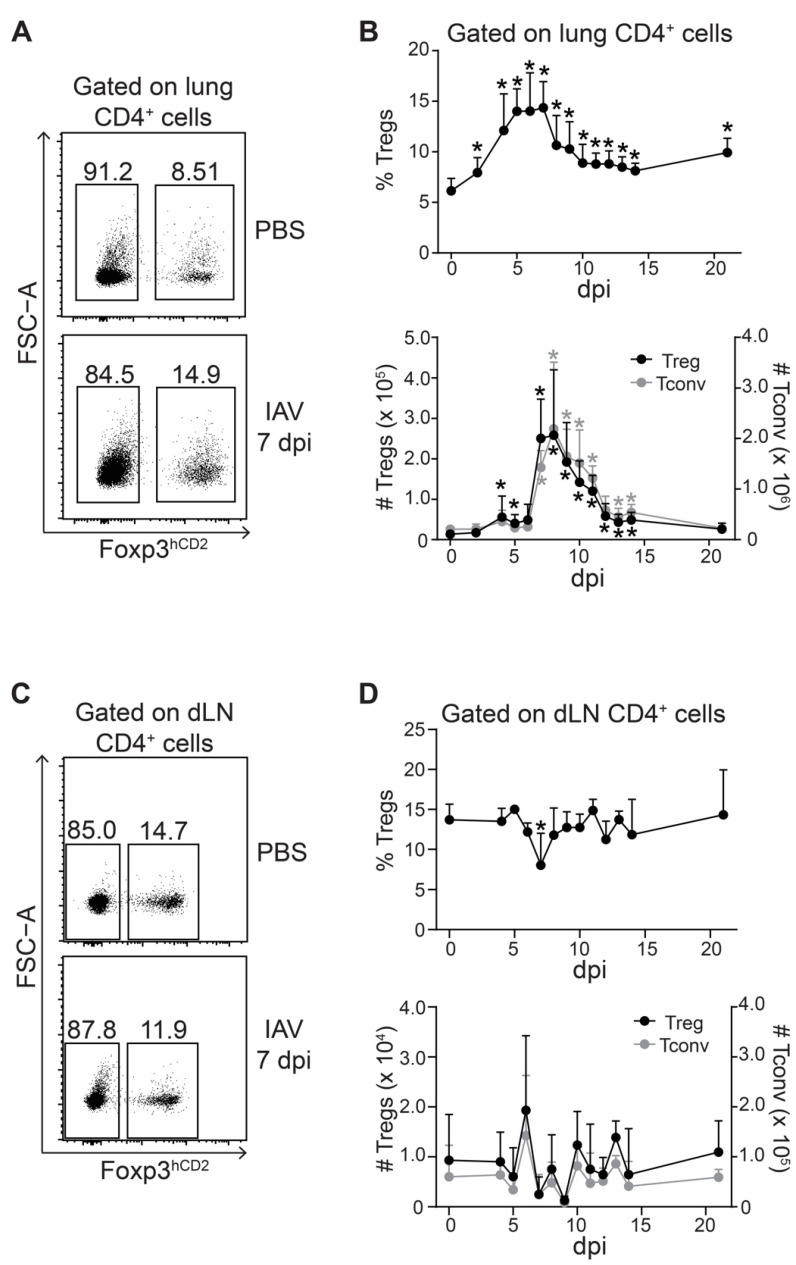
Figure 2.
Peak of Treg accumulation coincides with that of Tconv in IAV-infected lungs. Foxp3hCD2 × Rag1GFP reporter mice were infected with IAV and analyzed at indicated dpi. Lungs and dLNs were collected and prepared, and single-cell suspensions were restimulated and subsequently analyzed by flow cytometry; (A) Representative dot plots depict frequency of Foxp3hCD2+ Tregs and Foxp3hCD2- Tconv among CD4+ T cells in lungs of PBS-treated and IAV-infected mice (7 dpi); (B) Graphs summarize frequencies (top) and absolute numbers (bottom) of Tregs (black filled circles) and Tconv (gray filled circles); (C) Representative dot plots depict frequency of Foxp3hCD2+ Tregs and Foxp3hCD2- Tconv among CD4+ T cells in dLNs of PBS-treated and IAV-infected mice (7 dpi); (D) Graphs summarize frequencies (top) and absolute numbers (bottom) of Tregs (black filled circles) and Tconv (gray filled circles). Data were pooled from two to three independent experiments, which included 4–10 mice per group, and presented as mean + SD. Mann–Whitney test was used to calculate statistical significance by comparing values from untreated animals (for lung samples) or PBS-treated animals (for dLN samples) (0 dpi) with values from IAV-infected mice (2 to 21 dpi). Significant changes are indicated by an asterisk.

