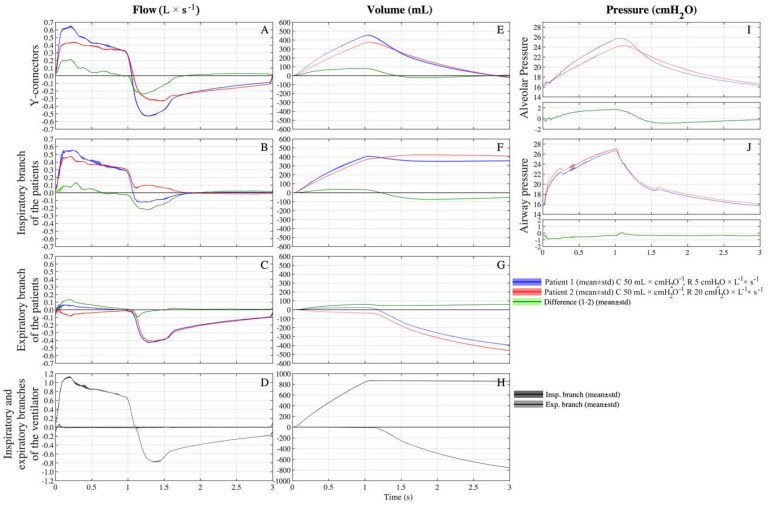
Figure 3.
Average (continuous line) ± standard deviation (filled area plot) of multiple breaths of flows, pressures and volumes across the custom-made circuit on setting C 50-50/R 5-20 (C = 50 mL × cmH2O−1 for both patients, R = 5 cmH2O × L−1 × s−1 for patient 1 and R = 20 cmH2O × L−1 × s−1 for patient 2). Blue = patient 1, red = patient 2; green = difference between patient 1 and 2; dark grey = inspiratory branch of the ventilator, light grey = expiratory branch of the ventilator. (A) Flows at Y-connectors. (B) Flows at inspiratory branch of patients. (C) Flows at expiratory branch of patients. (D) Flows at inspiratory and expiratory branches of ventilator. (E) Volumes at Y-connectors. (F) Volumes at inspiratory branch of patients. (G) Volumes at expiratory branch of patients. (H) Volumes at inspiratory and expiratory branches of ventilator. (I) Alveolar pressures. (J) Airways pressures at HME.

