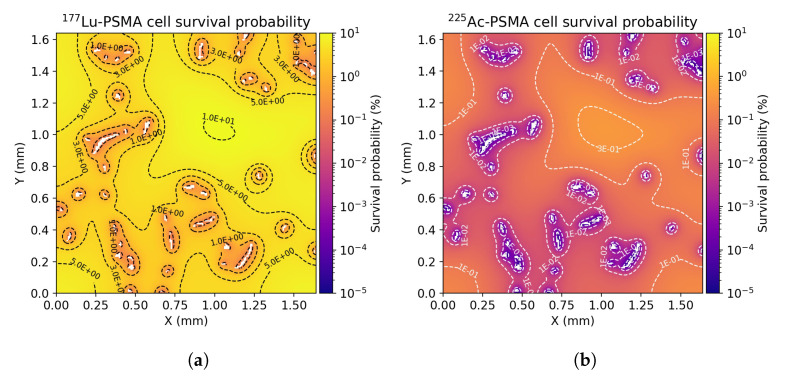
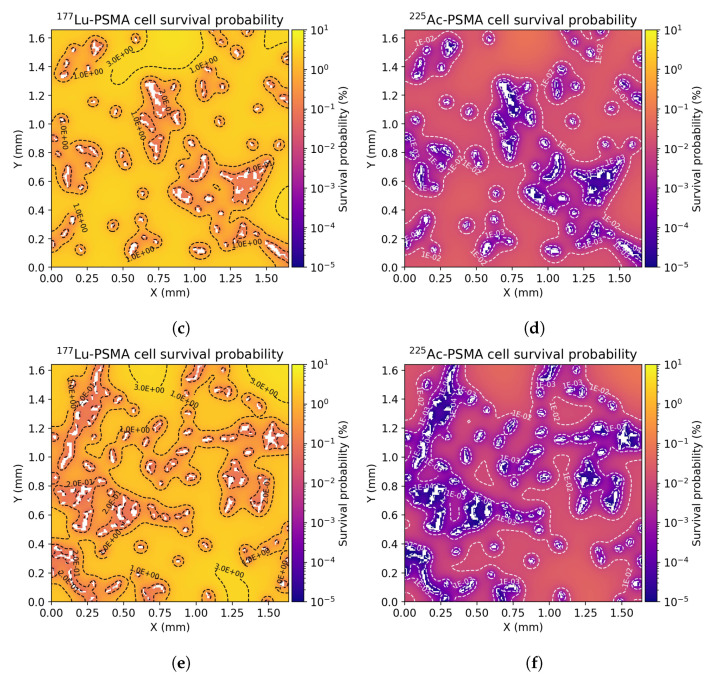
Figure 6.
(a,c,e) 2D distribution of cell survival probabilities in ROI A, ROI B and ROI C, respectively, within each tissue segment with Lu-PSMA treatment at twenty days post-injection. (b,d,f) 2D distribution of cell survival probabilities in ROI A, ROI B and ROI C, respectively, within each tissue segment with Ac-PSMA treatment at twenty days post-injection.


