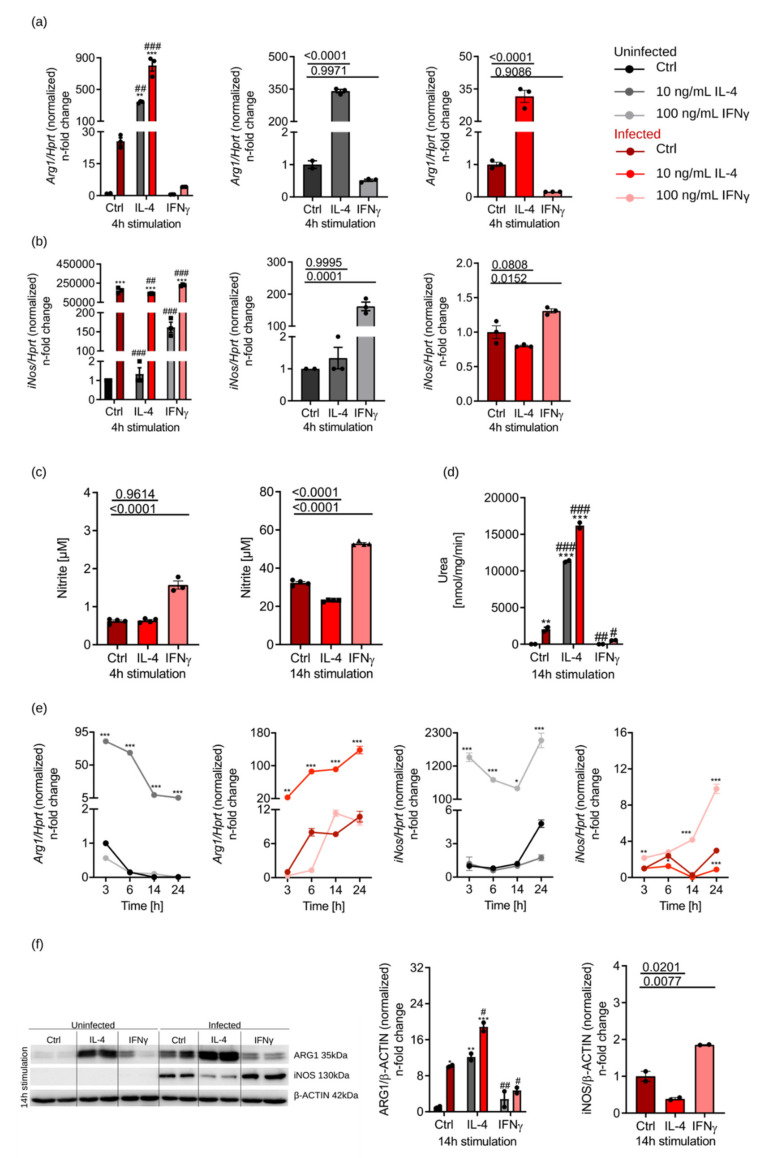
Figure 1.
ARG1 is upregulated by IL-4 and further enhanced after S.tm infection, but blocked by IFNγ. BMDM of C57BL/6N mice were infected (different shades of red) with S.tm and stimulated with IL-4 (10 ng/mL) or IFNγ (100 ng/mL) for 3–24 h. Uninfected (different shades of grey) and unstimulated BMDM (Ctrl) were used as a control. (a,b) Regulation of Arg1 and iNos expression due to infection and stimulation determined by RT-qPCR analysis. mRNA levels were normalised to the expression of the control gene hypoxanthin-guanin-phosphoribosyltransferase (Hprt). Ctrl samples were set to 1. Significant differences as determined by two-way ANOVA are marked **;## = p-value < 0.01; ***;### = p-value < 0.001. * indicates significant differences to uninfected Ctrl; # depicts significant differences to infected Ctrl. Otherwise, three groups were statistically analysed by one-way ANOVA. Exact p-values are indicated. (c) Nitrite concentrations in culture supernatants of infected BMDM as determined by the Griess reaction. Groups were statistically analysed by one-way ANOVA. Exact p-values are indicated. (d) ARG1 enzyme activity determined by measuring urea concentrations in cell lysates. Groups were statistically analysed by two-way ANOVA. Exact p-values are marked # = p-value < 0.05; **;## = p-value <0.01; ***;### = p-value < 0.001. * indicates significant differences to uninfected Ctrl; # depicts significant differences to infected Ctrl. (e) Cytokine-dependent regulation of Arg1 and iNos in uninfected and infected BMDM at different time points of stimulation (3–24 h). mRNA levels were normalized to the expression of the control gene Hprt and the 3 h Ctrl group was set to 1. Significant differences as determined by two-way ANOVA are marked * = p-value < 0.05; ** = p-value < 0.01; ***= p-value < 0.001. * indicates significant differences to uninfected Ctrl. (f) Protein expression of ARG1 and iNOS and densitometric quantification of results relative to β-ACTIN expression. Groups were statistically analysed by two-way ANOVA. Exact p-values are marked *;# = p-value < 0.05; **;## = p-value < 0.01; *** = p-value < 0.001. * indicates significant differences to uninfected Ctrl; # depicts significant differences to infected Ctrl. Otherwise, three groups were statistically analysed by one-way ANOVA. Exact p-values are indicated. Representative data of technical triplicates or quadruplicates are shown for (a–c) and (e); technical duplicates are shown for (d) and (f).

