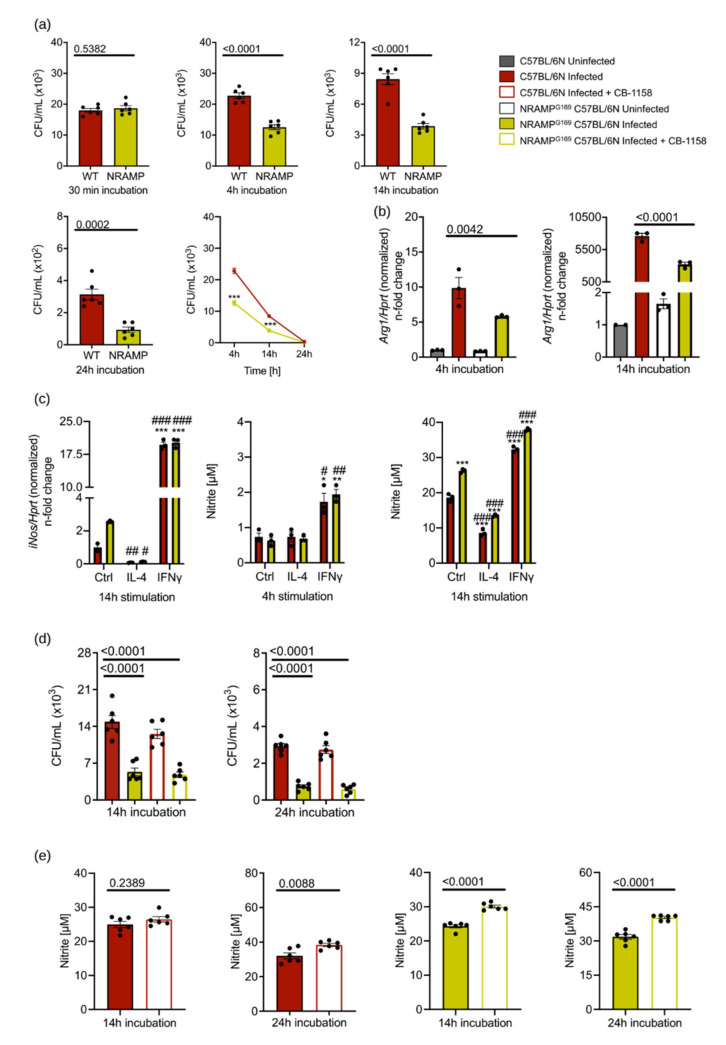
Figure 5.
NRAMP1 expression has no impact on the role of ARG1 in the control of S.tm infection. BMDM of NRAMPG169 C57BL/6N mice expressing functional NRAMP and BMDM from C57BL/6N were infected with S.tm and either left unstimulated or stimulated with 10 ng/mL IL-4 or 100 ng/mL IFNγ for 4–24 h. Furthermore, infected BMDM were stimulated with 50 µM CB-1158 for 14 and 24 h. (a) Bacterial burden at 30 min after infection and survival of S.tm in BMDM after 4, 14 and 24 h. Groups were statistically analysed by Student’s t-test. Exact p-values are indicated. CFU time course was statistically analysed by two-way ANOVA (*** = p-value < 0.001). * indicates significant differences to infected BMDM from C57BL/6N at specific time point. (b) Regulation of Arg1 expression upon infection and cytokine stimulation as determined by RT-qPCR analysis after 4 and 14 h. mRNA levels were normalised to the control Hprt. Uninfected Ctrl samples of C57BL/6N BMDM were set to 1. Significant differences were determined by one-way ANOVA. Exact p-values are indicated. (c) iNos expression after infection and cytokine stimulation as determined by RT-qPCR analysis after 14 h. mRNA levels were normalised to the control Hprt. Infected Ctrl samples of C57BL/6N BMDM were set to 1. Corresponding nitrite concentrations in culture supernatants of infected BMDM were determined by the Griess reaction. Groups were statistically analysed by two-way ANOVA. p-values are marked *;# = p-value < 0.05; **;## = p-value < 0.01; ***;### = p-value < 0.001. * indicates significant differences to infected unstimulated BMDM from C57BL/6N; # depicts significant differences to infected unstimulated BMDM of NRAMPG169 C57BL/6N. (d) Bacterial numbers in BMDM after 14 and 24 h of infection in the presence/absence of 50 µM CB-1158. Groups were statistically analysed by one-way ANOVA. Exact p-values are indicated (e) Nitrite concentrations in culture supernatants of infected versus infected and CB-1158-treated BMDM as determined by the Griess reaction. Groups were statistically analysed by Student’s t-test. Exact p-values are indicated. Representative data of triplicates of two experiments (a,d,e) or technical triplicates (b,c) are shown. Graphs show mean ± SEM.

