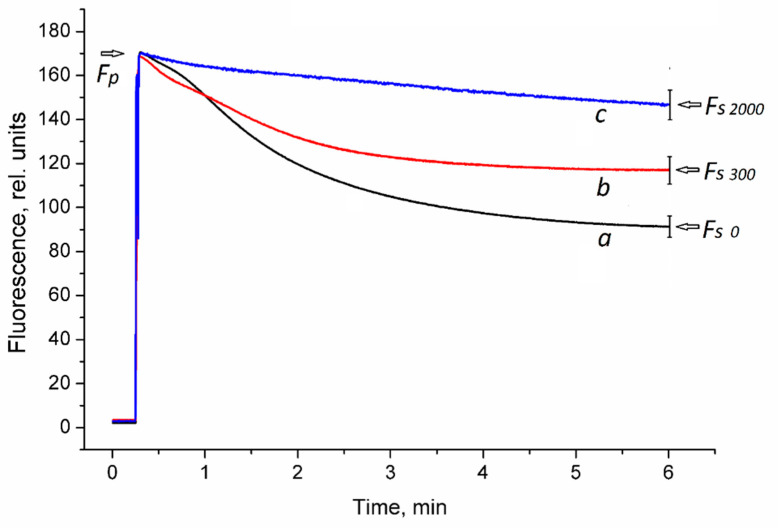
Figure 5.
Chlorophyll fluorescence kinetics in H. sativum leaves from plants germinated in the presence of different ZnO NP concentrations. Photoinduction curves averaged over 8 repetitions are shown. (a) 0 mg/L ZnO NPs (control); (b) 300 mg/L ZnO NPs; (c) 2000 mg/L ZnO NPs. Fp—peak (maximal) fluorescence level; Fs—steady-state fluorescence level. Curves were normalized by Fp. Fluorescence decrease ratios, Rfd = (Fp − Fs)/Fs, mean ± SD, were Rfd 0 = 0.87 ± 0.05, Rfd 300 = 0.45 ± 0.03, and Rfd 2000 = 0.16 ± 0.02 at p = 0.05, n = 8.

