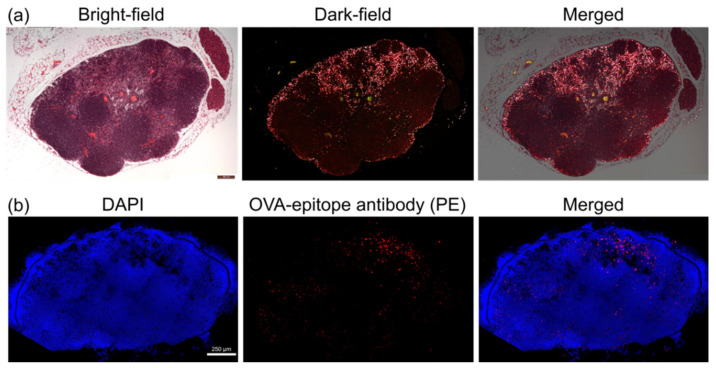
Figure 6.
Histological analysis of lymph nodes: (a) Bright-field (left), dark-field (middle), and merged (right) microscopic images of a histological sample of the cervical lymph node after the accumulation of GC-AuNPs. In the dark-field images, most signals of GC-AuNPs were found in the subcapsular and medullary sinuses where macrophages are abundant; (b) Fluorescent images of the cervical lymph nodes after the injection of OVA-GC-AuNPs. The red fluorescent color indicated the expression of the OVA epitope. Although the OVA epitope was observed throughout the whole lymph node area, the majority centered on medullary sinuses.

