Figure 2.
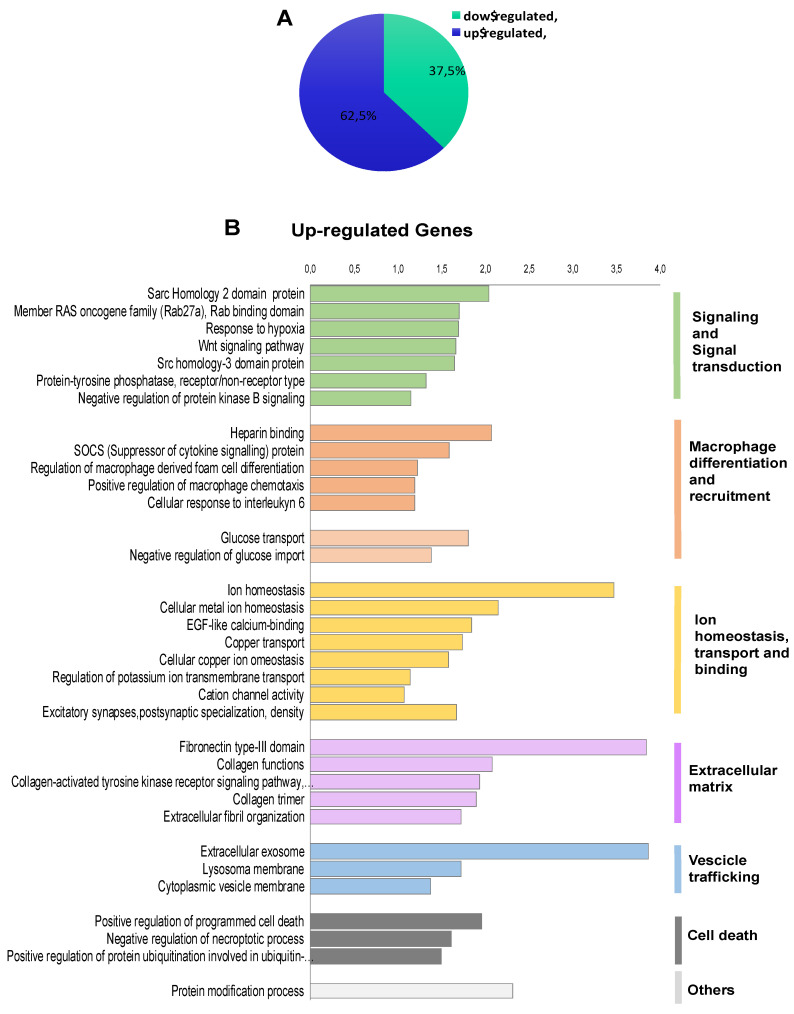
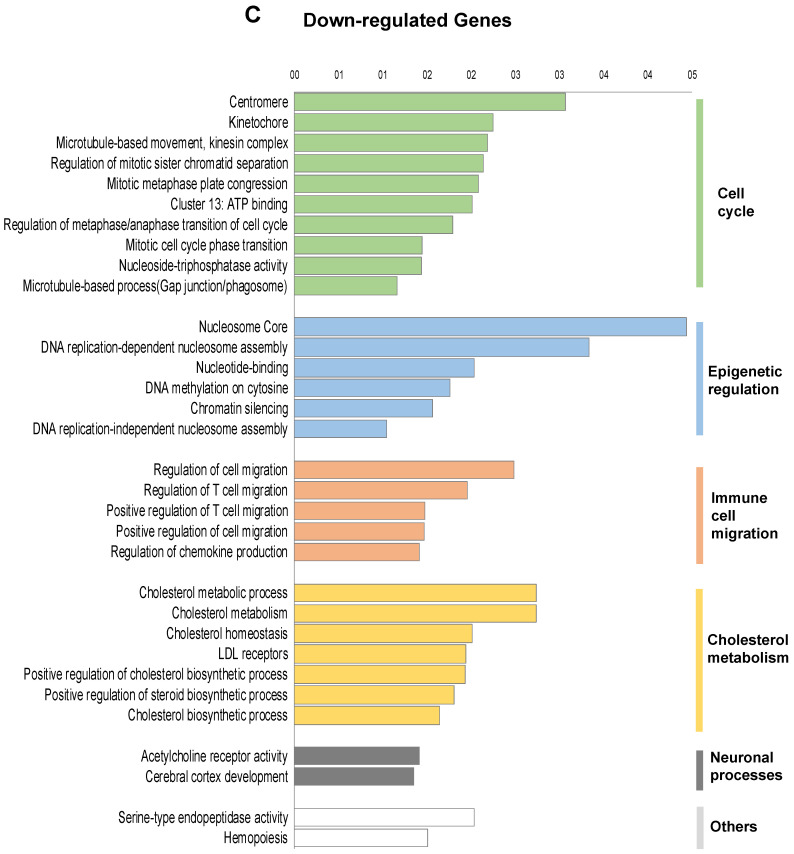
Functional annotation of differentially expressed genes in FOXE1-overxpressing cells. RNAseq analysis was performed on total RNA from FC55 and control cells. (A) Pie chart of differentially expressed genes (DEG), considered with a ±2-fold change (FC) and p ≤ 0.05 cut-off and analysed by Gene Ontology (GO). A total of 750 DEG resulted as being regulated, of which 469 (62.5%) upregulated and 281 (37.5%) downregulated. Functional categories were significantly enriched among genes that were either (B) upregulated or (C) downregulated. Functional categories (highlighted on the right in vertical groups) were obtained by clustering the functional annotation contained in the web-based DAVID database. To perform clustering, we used multiple annotations—namely, gene ontology for biological processes, molecular function and cellular components (GO_DIRECT), pathways, protein interactions, protein domain and tissue expressions. Enrichment scores are plotted only for clusters containing multiple terms with p < 0.05.


