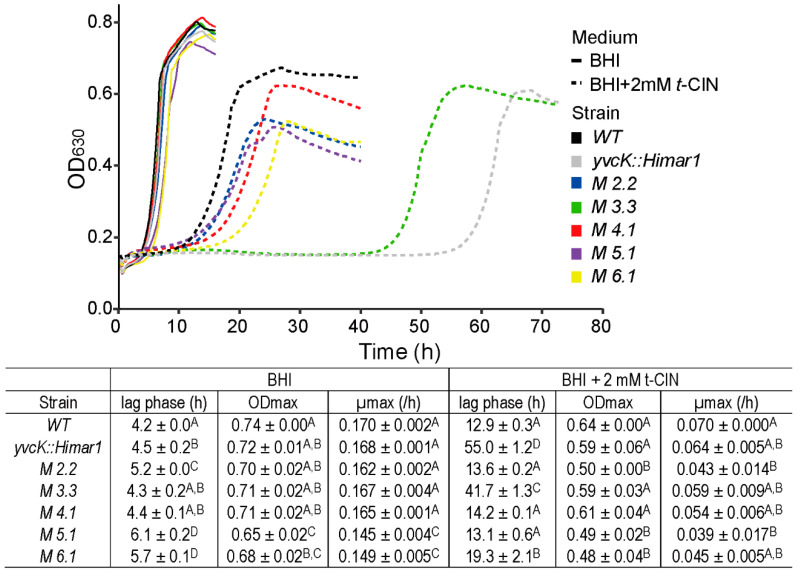
Figure 5.
Growth curves and parameters of suppression mutants which partially restore the tolerance of yvcK::Himar1 to t-CIN, in BHI and BHI with 2 mM t-CIN. Growth curves represent the average of measurements of three independent cultures. The lag phases (λ), maximum growth rates (µmax) and maximum optical densities (ODmax) are shown in the table as mean ± SD; n = 3. Values followed by a common letter are not significantly different at the 5% level of significance.

