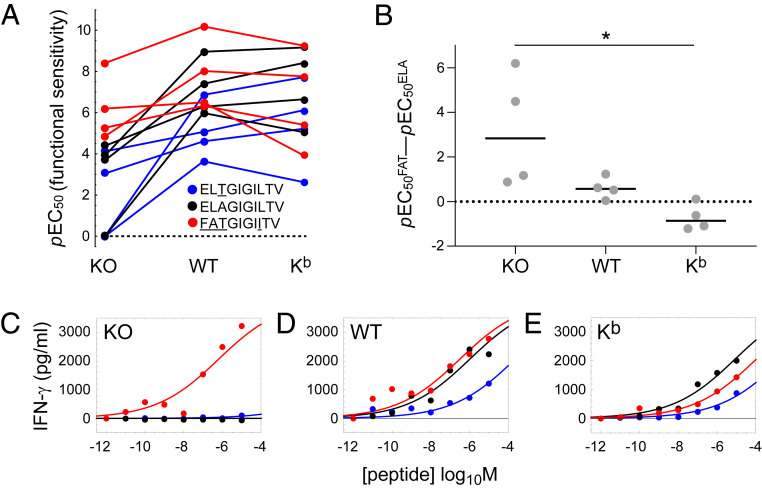
Fig. 2.
CD8 reorders the agonist hierarchy of peptide ligands that induce the production of IFN-γ. Clonal MEL5 CD8+ T cells were activated for 4 h with C1R cells expressing comparable levels of HLA-A2 D227K/T228A (KO), wild-type HLA-A2 (WT), or HLA-A2 Kb (Kb) pulsed with various concentrations of 3T (blue), ELA (black), or FAT (red). Secretion of IFN-γ was measured using an enzyme-linked immunosorbent assay. (A) Functional sensitivity (pEC50) for each peptide ligand in the context of each MHCI. Four replicate experiments are shown. Values below the limit of estimation were set to zero for graphical purposes and treated as missing data for statistical purposes. P = 0.0042 for the ligand effect and P = 0.00069 for the MHCI effect (two-way ANOVA with Tukey’s post hoc test). (B) The agonist potency of FAT relative to the agonist potency of ELA expressed as pEC50FAT − pEC50ELA, which is equivalent to the logarithm of the fold difference in functional sensitivity. Four replicate experiments are shown. Horizontal bars indicate median values. *P < 0.05 (one-way ANOVA with Tukey’s post hoc test). (C–E) Representative peptide titration experiment used to calculate the parameters in A and B. Curves were fitted in Mathematica. All four replicate experiments are shown in SI Appendix, Figs. S4 and S5.

