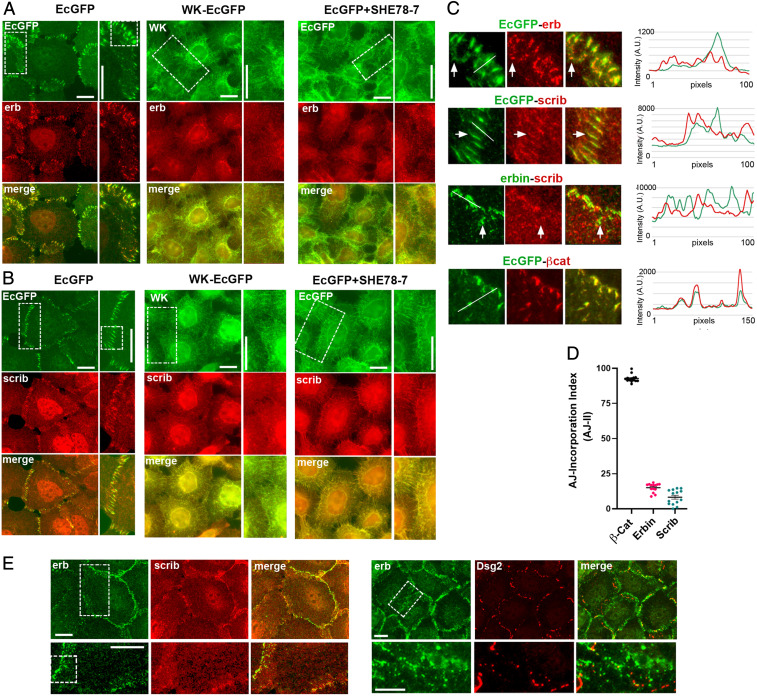
Fig. 3.
Subcellular localization of erbin and scribble clusters. (A and B) Immunofluorescence microscopy of A431 cells expressing the GFP-tagged form of cadherin (green) and erbin (erb; red; A) or scribble (scrib; red; B) in various backgrounds (abbreviations are as in Fig. 1A): EcGFP in Ec-KO (EcGFP), WK-EcGFP in Ec/Pc-KO (WK-EcGFP), or EcGFP in Ec-KO, which were cultured for 20 min with the function-blocking E-cadherin mAb SHE78-7 (EcGFP+SHE78-7). The boxed regions indicated in the green images are magnified (Right) (A, B, and E). The boxed regions in the magnified portions are further enlarged in C. (C) Cell–cell contact regions showing relative localization for pairs of proteins: E-cadherin and erbin (EcGFP-erb), E-cadherin and scribble (EcGFP-scrib), erbin and scribble (erb-scrib), and E-cadherin and β-catenin as a control (EcGFP-βCat). In all cases but the control (Bottom), the red clusters only partially correspond to AJs. The arrows show one of the AJ-separated erbin or scribble clusters (in EcGFP-erb or EcGFP-scrib) or scribble-deficient erbin clusters (in erbin-scrib). Line scans performed along the white lines are shown (Right). A.U., arbitrary unit. (D) The AJ incorporation index, which is defined as the ratio between the area of erbin- or scribble-specific fluorescence of the selected AJs and the total area of the same AJs defined by EcGFP fluorescence. Median values are indicated by horizontal bars; n = 15. (E) Immunofluorescence microscopy of A431 cells double-stained for erbin (green) and scribble (red) or for erbin (green) and Desmoglein-2 (Dsg2; red). Erbin clusters do not correspond to scribble clusters or to desmosomes. The boxed regions are enlarged (Right) and further zoomed-in (C). (Scale bars, 10 μm.)

