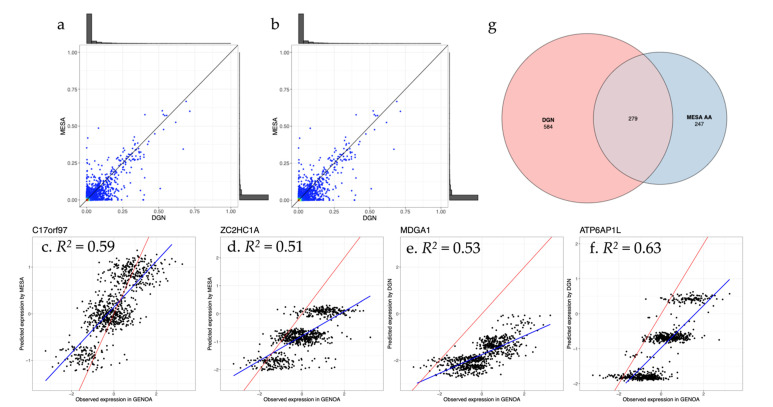
Figure 4.
Smooth scatter plots comparing true gene expression from Genetic Epidemiology Network of Arteriopathy (GENOA) lymphoblastoid (LCL) data to predicted gene expression using Depression Genes and Networks (DGN) and Multi-Ethnic Study of Atherosclerosis (MESA) African ancestry (AA) reference eQTL datasets. (a) True R2 distribution using the Depression Genes and Networks (DGN) and Multi-Ethnic Study of Atherosclerosis (MESA) eQTL reference panel for all genes (# genes = 4043); (b) true R2 distribution for genes with model R2 > 0.05 in each reference eQTL dataset (# genes = 3426); (c–f). Prediction performance of four examples of well-predicted genes. The scatter plots show the observed expression in GENOA versus predicted expression using prediction models build using MESA AA (c,d) and DGN (e,f). The observed expression in GENOA is from array data in LCLs. The red line is the diagonal line with slope = 1 and the blue line is the fitting line between the observed expression and predicted expression; (g) Venn diagram of well-predicted genes (true R2 > 0.05) by DGN and MESA AA reference panels in GENOA.

