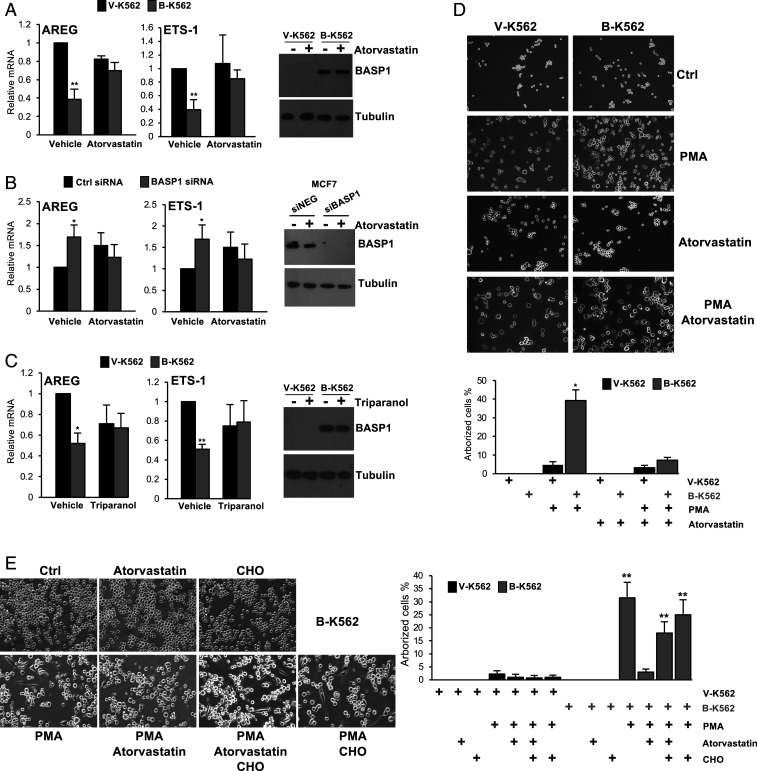
Fig. 5.
Statins specifically inhibit the transcriptional repressor function of BASP1. (A) V-K562 or B-K562 cells were treated with 20 μM atorvastatin or drug vehicle (DMSO) for 48 h. cDNA was prepared, and expression of AREG and ETS-1 was determined relative to GAPDH. At Right, a Western blot of BASP1 is shown. (B) MCF7 cells were transfected with either a control siRNA (siNEG) or siRNA targeting BASP1 (siBASP1). 24 h later, the cells were treated with 20 μM atorvastatin or drug vehicle (DMSO) for 48 h. cDNA was prepared, and expression of AREG and ETS-1 was determined relative to GAPDH. At Right, a Western blot of BASP1 is shown. (C) As in A, except that cells were treated with 20 μM triparanol. (D) V-K562 cells or B-K562 cells were treated with PMA (200 nM) and/or atorvastatin (20μM) as indicated. 72 h later, the cells were analyzed as in Fig. 4A. Percentage arborized cells is below (error bars are SDM of three independent experiments, and * indicates Student’s t test P < 0.05.) (E) As in D, except that cholesterol was also added to the media (100 μM) where indicated. Percentage arborized cells is at Right (error bars are SDM of four independent experiments, and ** indicates Student’s t test P < 0.01). Graph also includes quantitation from similarly treated V-K562 cells (images shown in SI Appendix, Fig. S2D).

