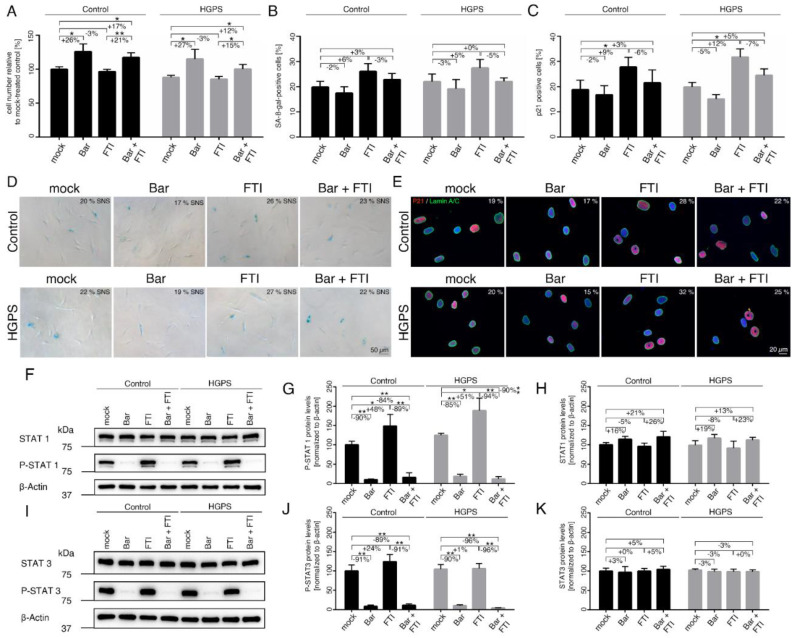
Figure 1.
Replicative senescence of control and HGPS fibroblasts after treatment with baricitinib and FTI. (A) Cell numbers relative to mock-treated control cells. All cultures were started with ~15% senescence. Cells were either treated with vehicle (DMSO), Bar (1 µM), FTI (0.025 µM), or combined drugs for a period of nine days. (B) Graph shows the percentage of SA-ß-gal-positive cells measured after indicated treatments. (C) Percentage of cells positive for p21 after indicated treatment. (D) Representative images of SA-ß-gal-positive cells in treated cultures. Scale bar: 50 µm. (E) Representative immunofluorescence images of control GM01651C and HGPS HGADFN127 fibroblasts after the indicated treatment. Antibodies against p21 (red) and lamin A/C (green) were used, and DNA was stained with DAPI. Fluorescence images were taken at 40× magnification. Scale bar: 20 µm. (F,I) Representative images of western blots for STAT1, P-STAT1, STAT3 and P-STAT3. Quantification of P-STAT1 (G), STAT1 (H), P-STAT3 (J), and STAT3 (K). Graphs show mean ± SD. Representative images are shown (n = 3; * p < 0.05, ** p < 0.01).

